Blog > 14 Accounts Receivable KPIs For Your AR Team to Prioritize
14 Accounts Receivable KPIs For Your AR Team to Prioritize

Since effective management of accounts receivable (AR) is key to your company’s cash flow, financial stability, and long-term growth, monitoring various metrics is essential.
One of the best ways to evaluate the performance of your AR team is by tracking key performance indicators (KPIs). These metrics provide valuable insights into how well your team collects payments, manages risk, and maintains customer relationships.
From measuring collection speed to monitoring staff productivity, each KPI can strengthen your receivables processes and improve your bottom line by providing valuable insights into how well your team collects payments, manages risk, and maintains customer relationships.
Since these metrics are vital to your business operations and overall success, identifying various KPIs is important. This article will help explore 14 essential accounts receivable key performance indicators that your business should prioritize.
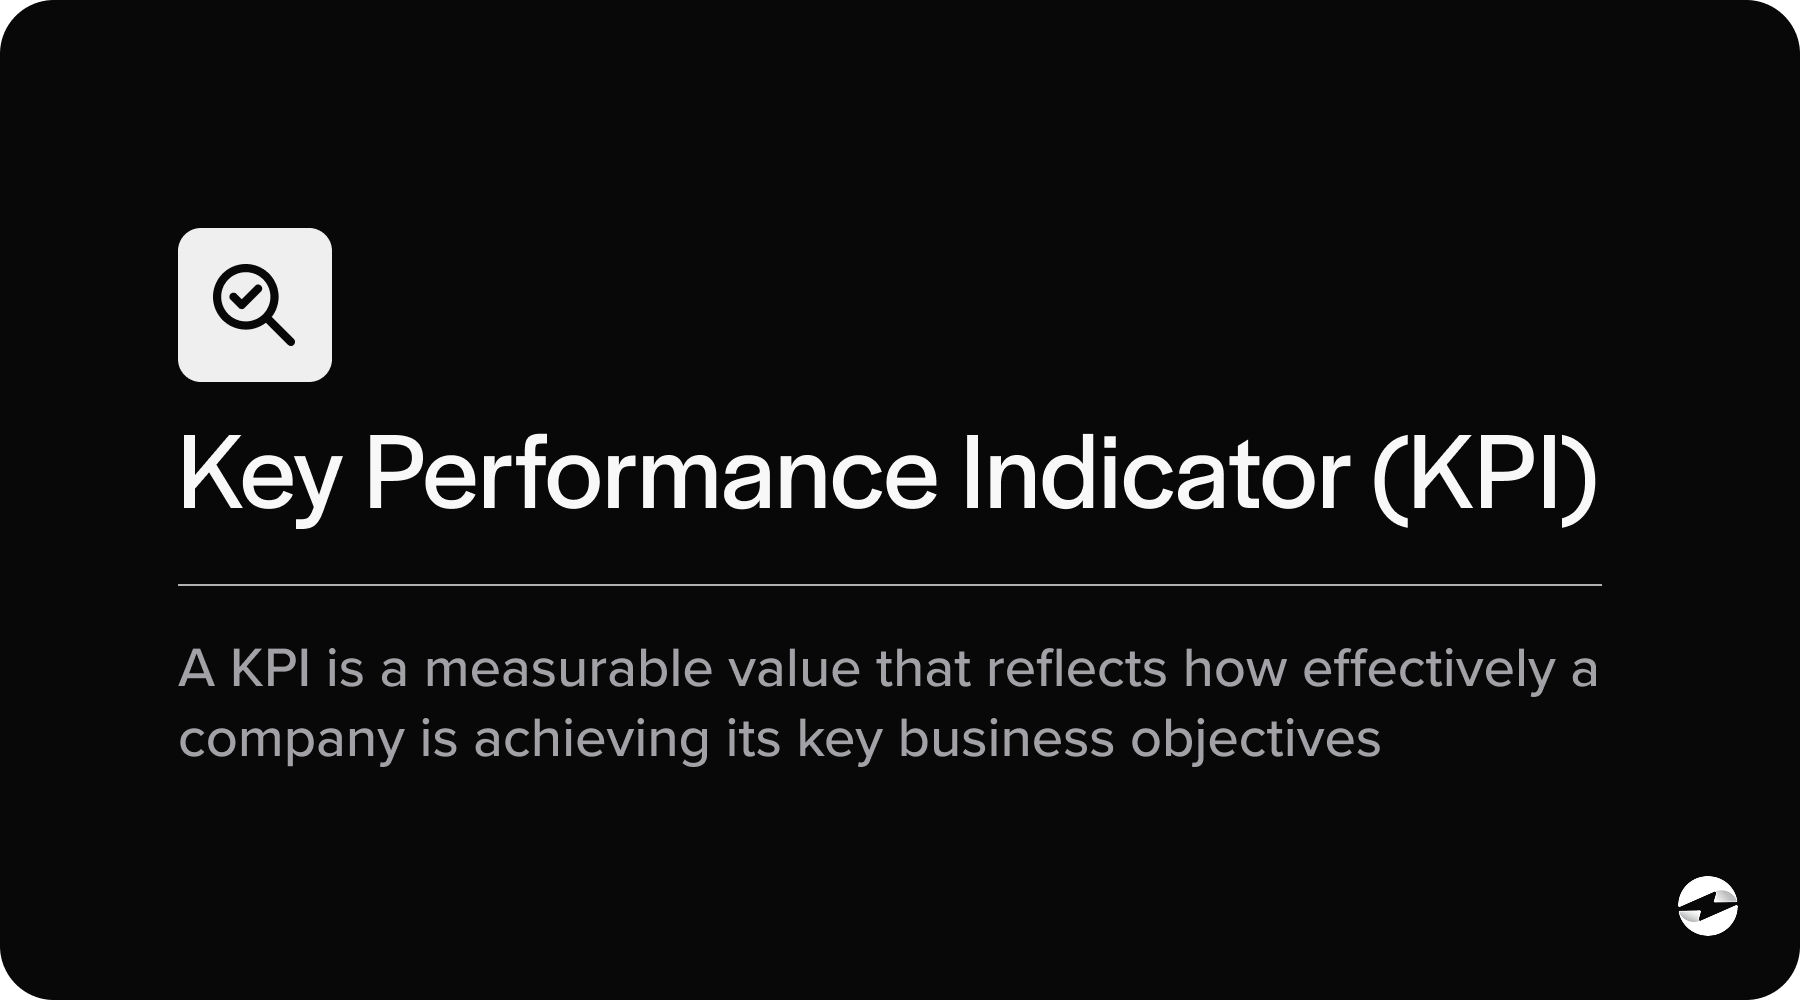
What is a key performance indicator (KPI)?
A key performance indicator (KPI) is a measurable value that reflects how effectively a company is achieving its key business objectives. KPIs provide a clear picture of whether a business is on track or if adjustments are needed to realign with its goals. Their primary purpose is to monitor the performance of specific processes and deliver insights that highlight areas for improvement.
For KPIs to be effective, they must be directly aligned with the company’s strategic objectives, ensuring that what’s being measured supports long-term success. They also must be quantifiable, providing concrete data that can be tracked and analyzed over time.
While specific KPIs may vary by industry or business, they all universally aim to promote more data-driven decision-making and operational excellence.
Whether an organization is measuring financial stability, customer satisfaction, or internal process efficiency, KPIs play a central role in strategic planning and long-term growth.
Which KPIs should AR teams prioritize?
When it comes to optimizing your AR performance, tracking the right KPIs is essential since each metric offers a unique perspective on the health of your receivables and your team’s effectiveness.
By monitoring and acting on these insights, AR teams can improve collection efforts, reduce operational costs, and contribute to stronger cash flow management.
Here are 14 accounts receivable KPIs your AR team should prioritize:
- Accounts receivable turnover ratio
- Days Sales Outstanding (DSO)
- Average collection period
- Expected cash collections
- Average Days Delinquent (ADD)
- Collection Effectiveness Index (CEI)
- Percentage of high-risk accounts
- Number of revised invoices
- Collection cost per invoice
- Payment terms compliance rate
- Credit utilization ratio
- Bad debt
- Staff productivity
- Customer satisfaction
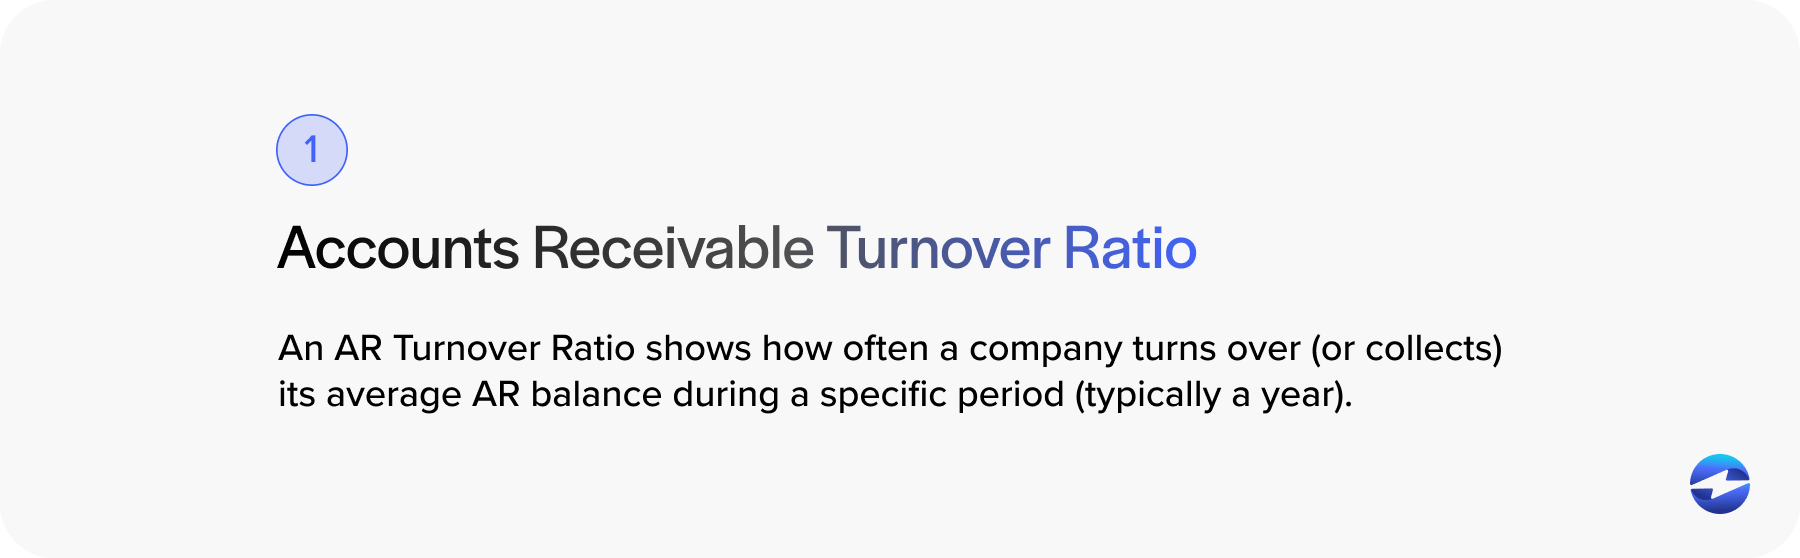
1. Accounts receivable turnover ratio
Accounts receivable turnover ratio, or AR turnover ratio, is a financial metric that measures how efficiently a business collects its outstanding credit sales. Specifically, it shows how often a company turns over (or collects) its average AR balance during a specific period (typically a year).
A high turnover ratio indicates that the company collects payments quickly and efficiently, while a low turnover ratio may suggest collection delays, ineffective credit policies, or customer payment issues.
Why it’s important
Tracking the AR turnover ratio is important because it directly relates to a company’s financial health and operational efficiency. Here’s how:
- Improves cash flow: Faster collections mean more cash on hand for operations, payroll, and growth.
- Indicates timely payments: A higher turnover may suggest customers are paying on time.
- Highlights credit policy effectiveness: Frequent turnover suggests well-managed credit and collections policies.
- Identifies potential risks: A declining ratio may signal trouble collecting payments or overly lenient credit terms.
How to calculate it
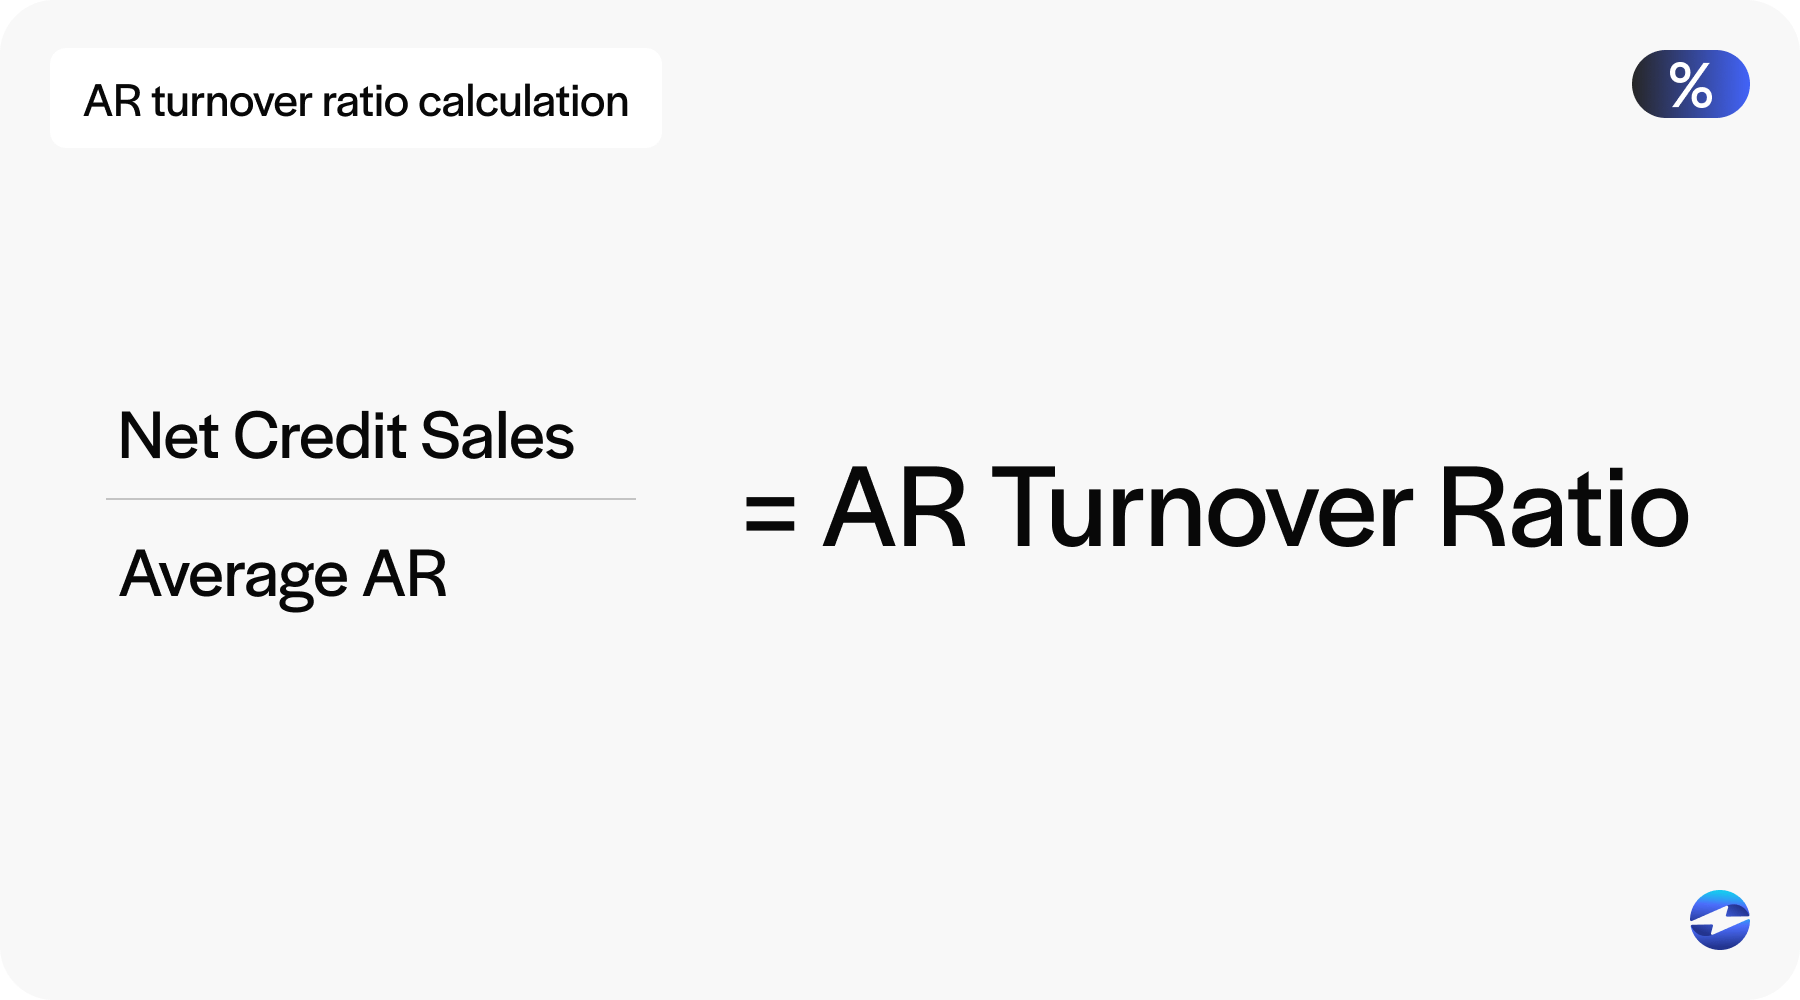
Accounts Receivable Turnover Ratio = Net Credit Sales / Average Accounts Receivable
- Net Credit Sales: Total sales made on credit (excluding cash sales and returns)
- Average AR: (Beginning AR + Ending AR) / 2
Example
Let’s say a company has the following data for the year:
- Net credit sales: $1,200,000
- Beginning AR: $100,00
- Ending AR: $140,000
First, calculate the average accounts receivable:
Average AR = ($100,000 + $140,000) / 2 = $120,000
Then, apply the turnover formula:
AR Turnover = $1,200,000 / $120,000 = 10
This means the company collected its average receivables 10 times during the year, which typically indicates strong credit management and efficient collections.
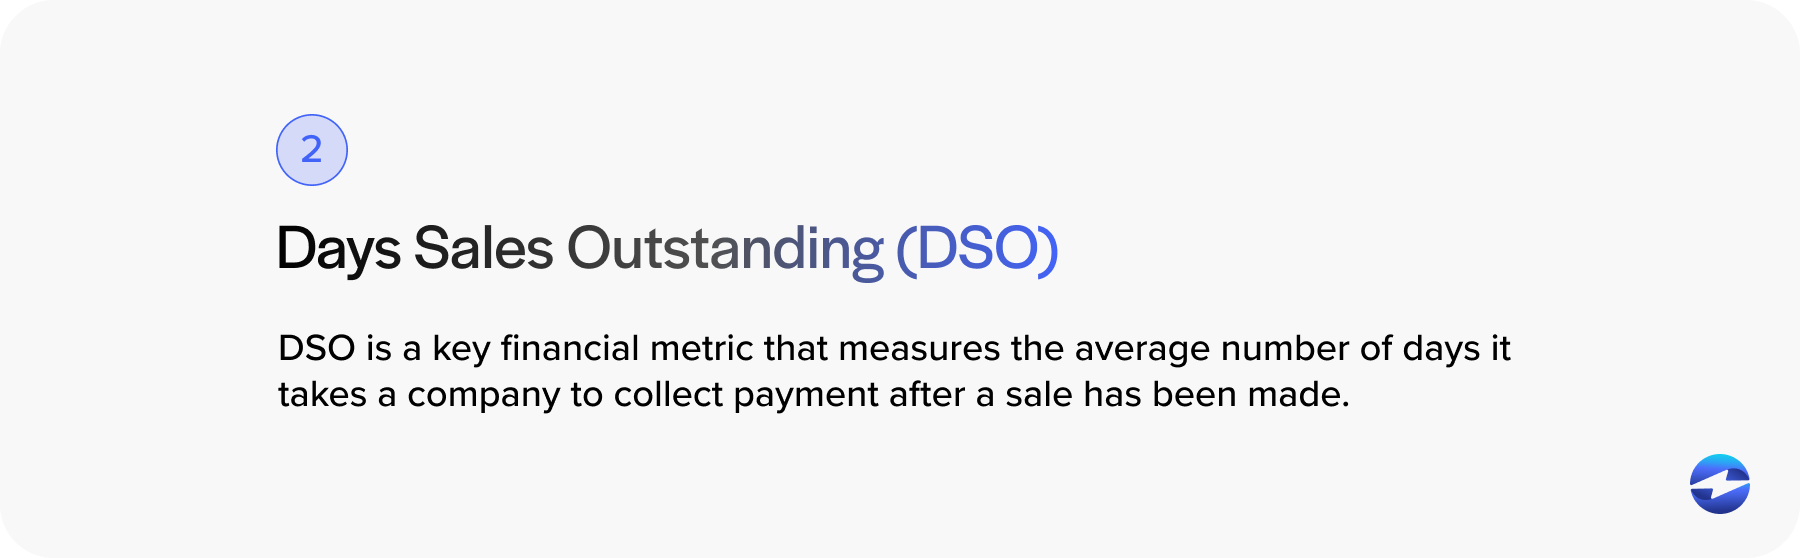
2. Days Sales Outstanding (DSO)
Days sales outstanding (DSO) is a key financial metric that measures the average number of days it takes a company to collect payment after a sale has been made.
DSO reflects how efficiently a business manages its AR and how quickly it converts credit sales into cash.
Why it’s important
A high DSO may indicate that a business is taking too long to collect payments, leading to cash shortages and hindering operations. Conversely, a low DSO suggests that a company is collecting payments promptly and maintains healthy liquidity.
Overall, DSO helps businesses identify potential issues in their collection process, monitor customer payment behavior, improve cash flow forecasting, and maintain financial stability.
How to calculate it
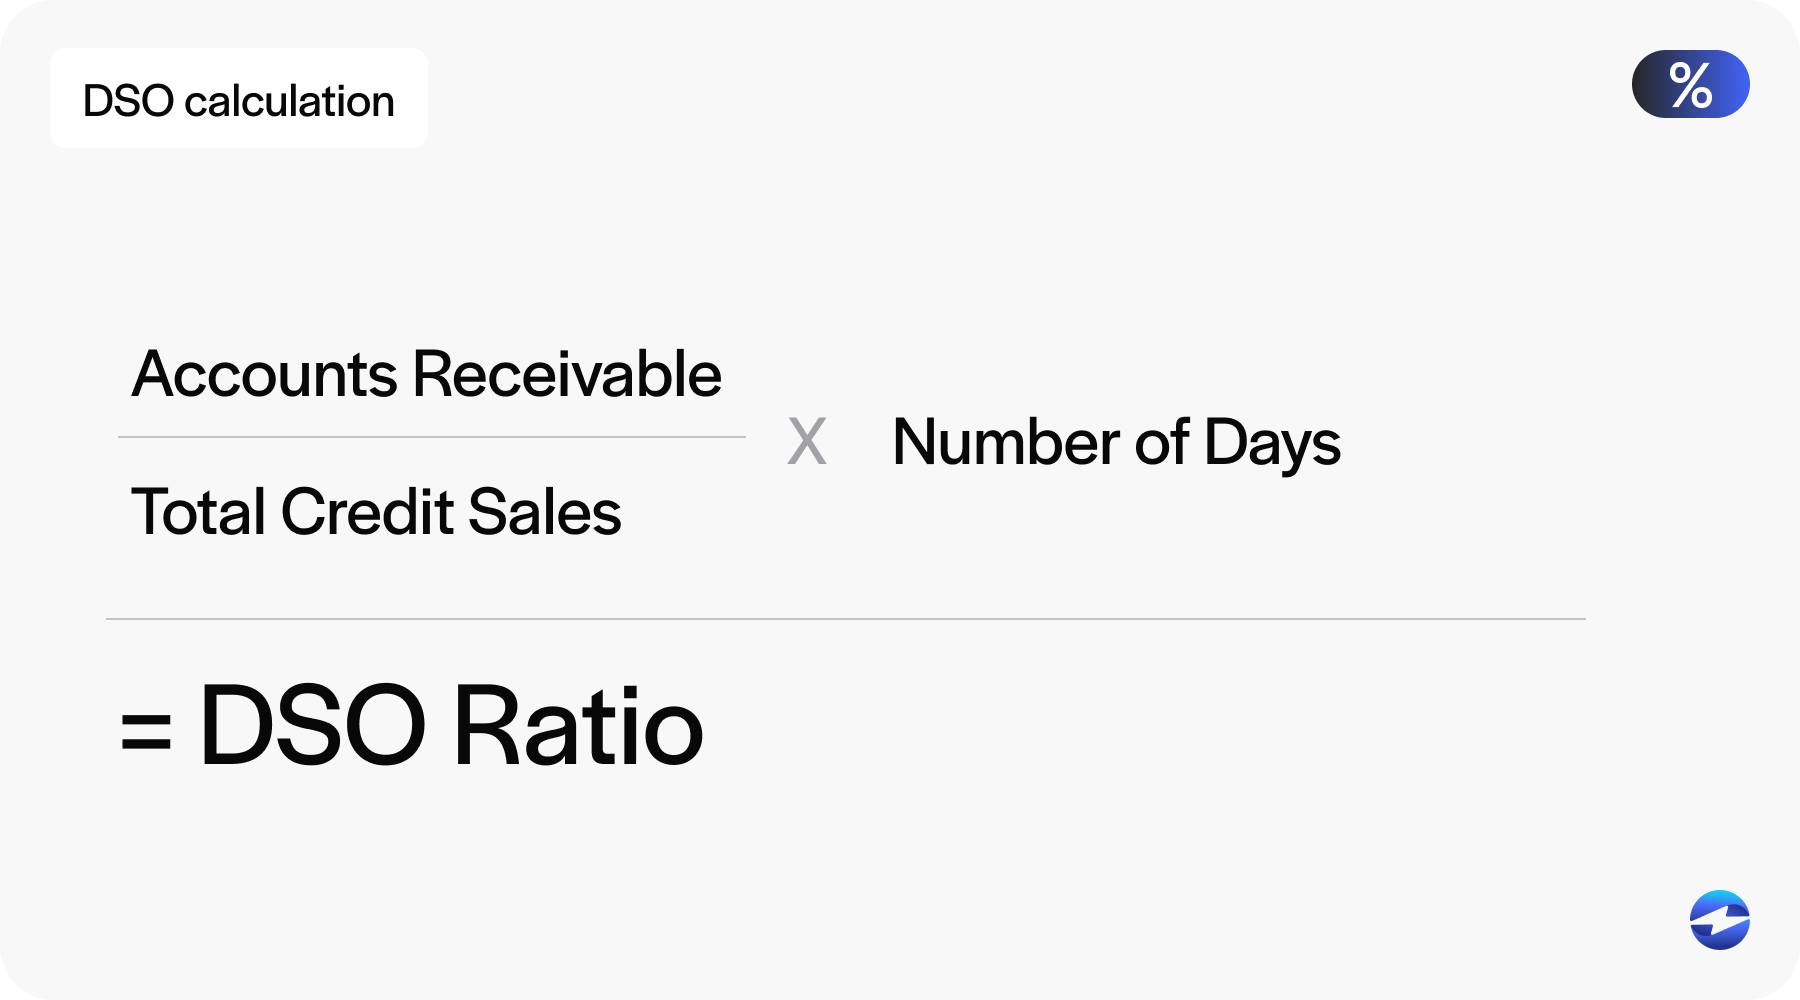
DSO = (Accounts receivable / Total credit sales) x Number of Days
- Accounts receivable: The amount owed by customers at the end of the period
- Net Credit Sales: Total credit sales during the period (excluding cash sales and returns)
- Number of days: Typically 30, 60, 90, or 365 days (depending on the reporting period)
Example
Let’s say a company has:
- $150,000 in AR
- $450,000 in total credit sales over a 30-day period
DSO = ($150,000 / $450,000) x 30 = 10 days
This means it takes the company an average of 10 days to collect payment after making a sale, which likely indicates a strong DSO with efficient collections and positive cash flow.
3. Average collection period
The average collection period is an accounting metric that shows the average number of days a company takes to collect customer payments after a credit sale. It’s essentially another way to understand how long it takes for receivables to be converted into cash.
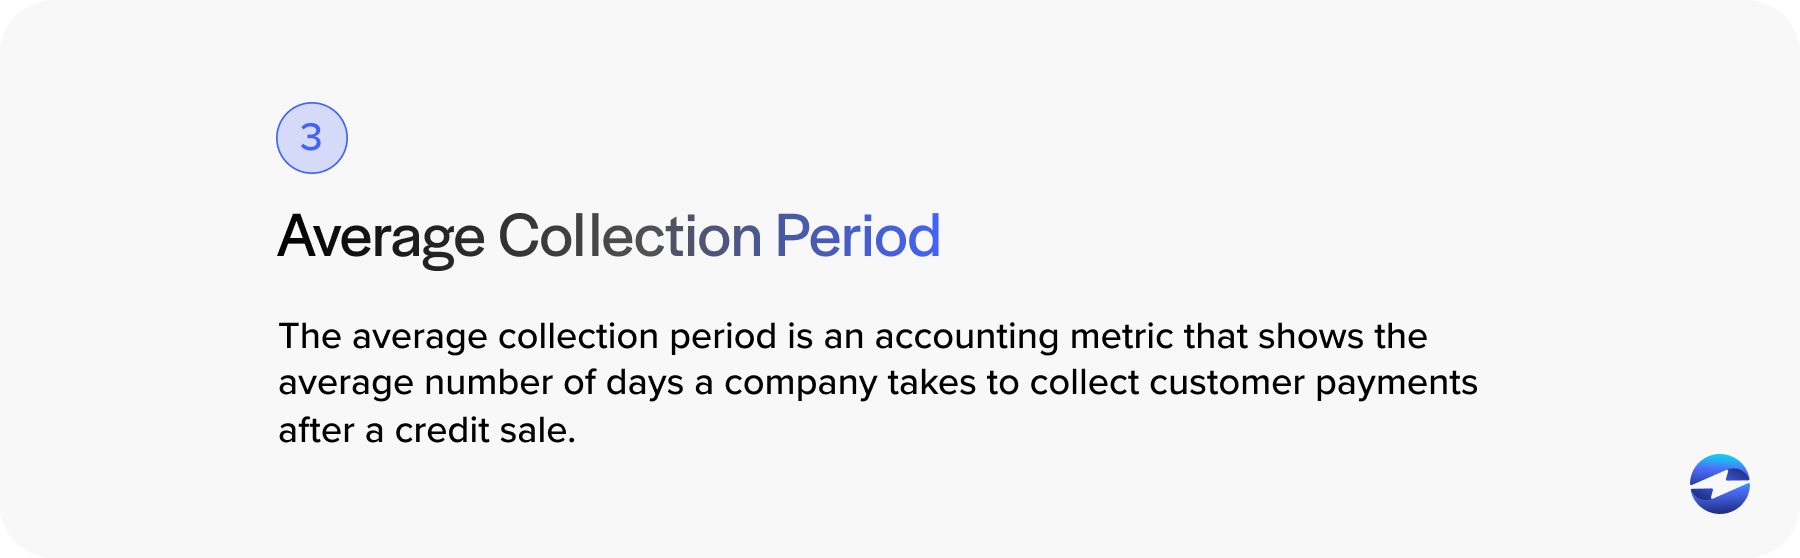
This metric is closely related to DSO but is often used more explicitly in accounting and financial reporting.
Why it’s important
Tracking the average collection period is crucial because it helps businesses understand the efficiency of their credit and collection processes.
A shorter collection period typically means the company is collecting cash faster, improving liquidity and reducing the risk of bad debts.
Monitoring average collection periods can help businesses maintain steady cash flow, evaluate the effectiveness of credit policies, identify potential collection issues early, and benchmark performance against industry standards.
How to calculate it
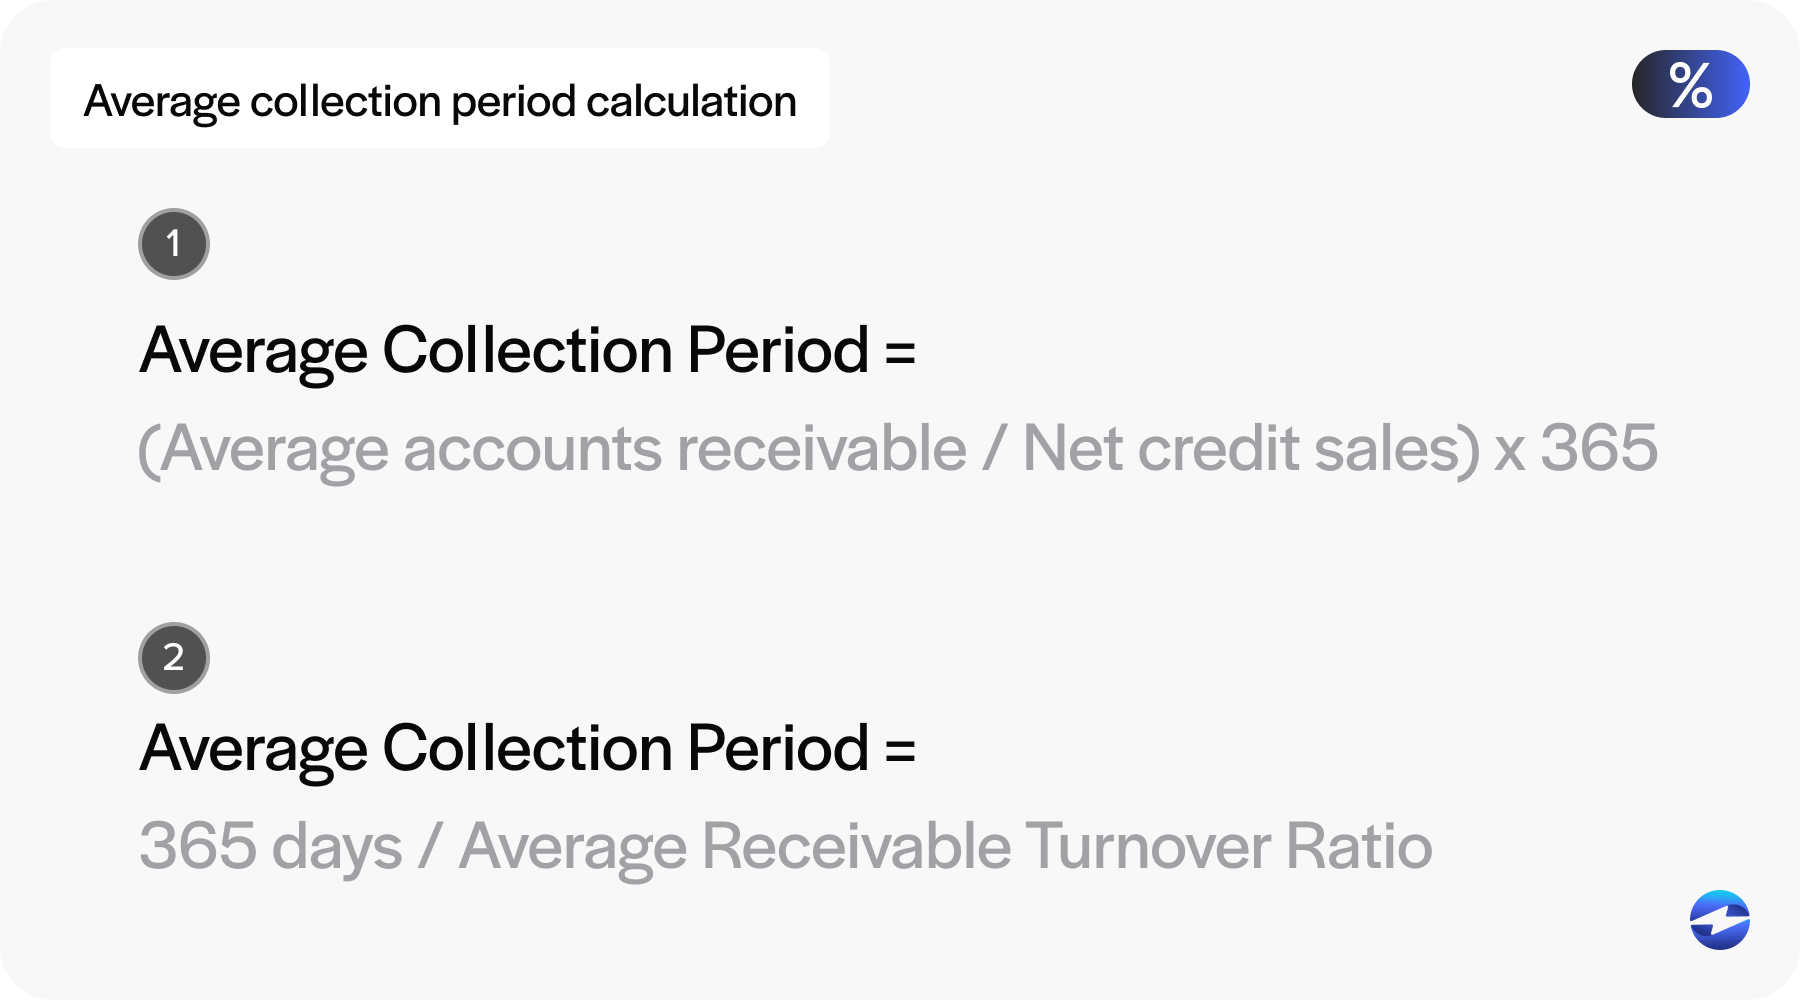
Average Collection Period = (Average accounts receivable / Net credit sales) x 365
OR
Average Collection Period = 365 days / Average Receivable Turnover Ratio
Example
Suppose a company has:
- $100,000 in AR
- $600,000 in net credit sales
- The time period is 365 days
Average Collection Period = ($100,000 / $600,000) x 365 = 60.8 days
This means it takes the company an average of about 61 days to collect customer payments. Depending on the company’s credit terms, this may be normal or highlight a need to improve collections efforts.
4. Expected cash collections
Expected cash collections is a forecasting metric that estimates the amount of cash a business expects to collect from its credit sales over a specific period.
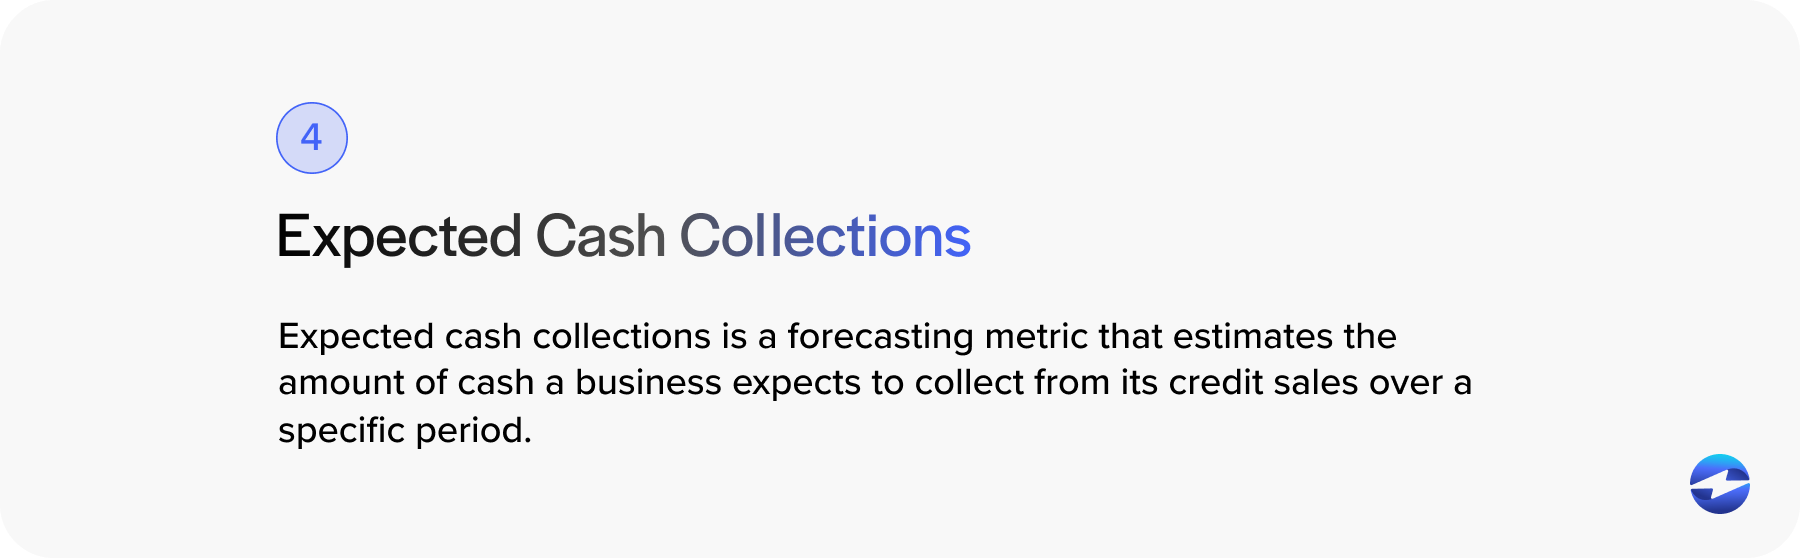
These projected collections include payments expected from AR based on customer payment patterns or credit terms.
Expected cash collections help businesses anticipate incoming cash from customers who purchased on credit.
Why it’s important
Tracking expected cash collections is essential because it assists businesses in:
- Accurate cash flow forecasting
- Planning for operating expenses, investments, or debt payments
- Evaluating the effectiveness of their AR process
- Pinpointing potential cash availability shortfalls before they happen
How to calculate it
Expected cash collections are calculated by applying the company’s historical collection percentages to credit sales over specific time periods.
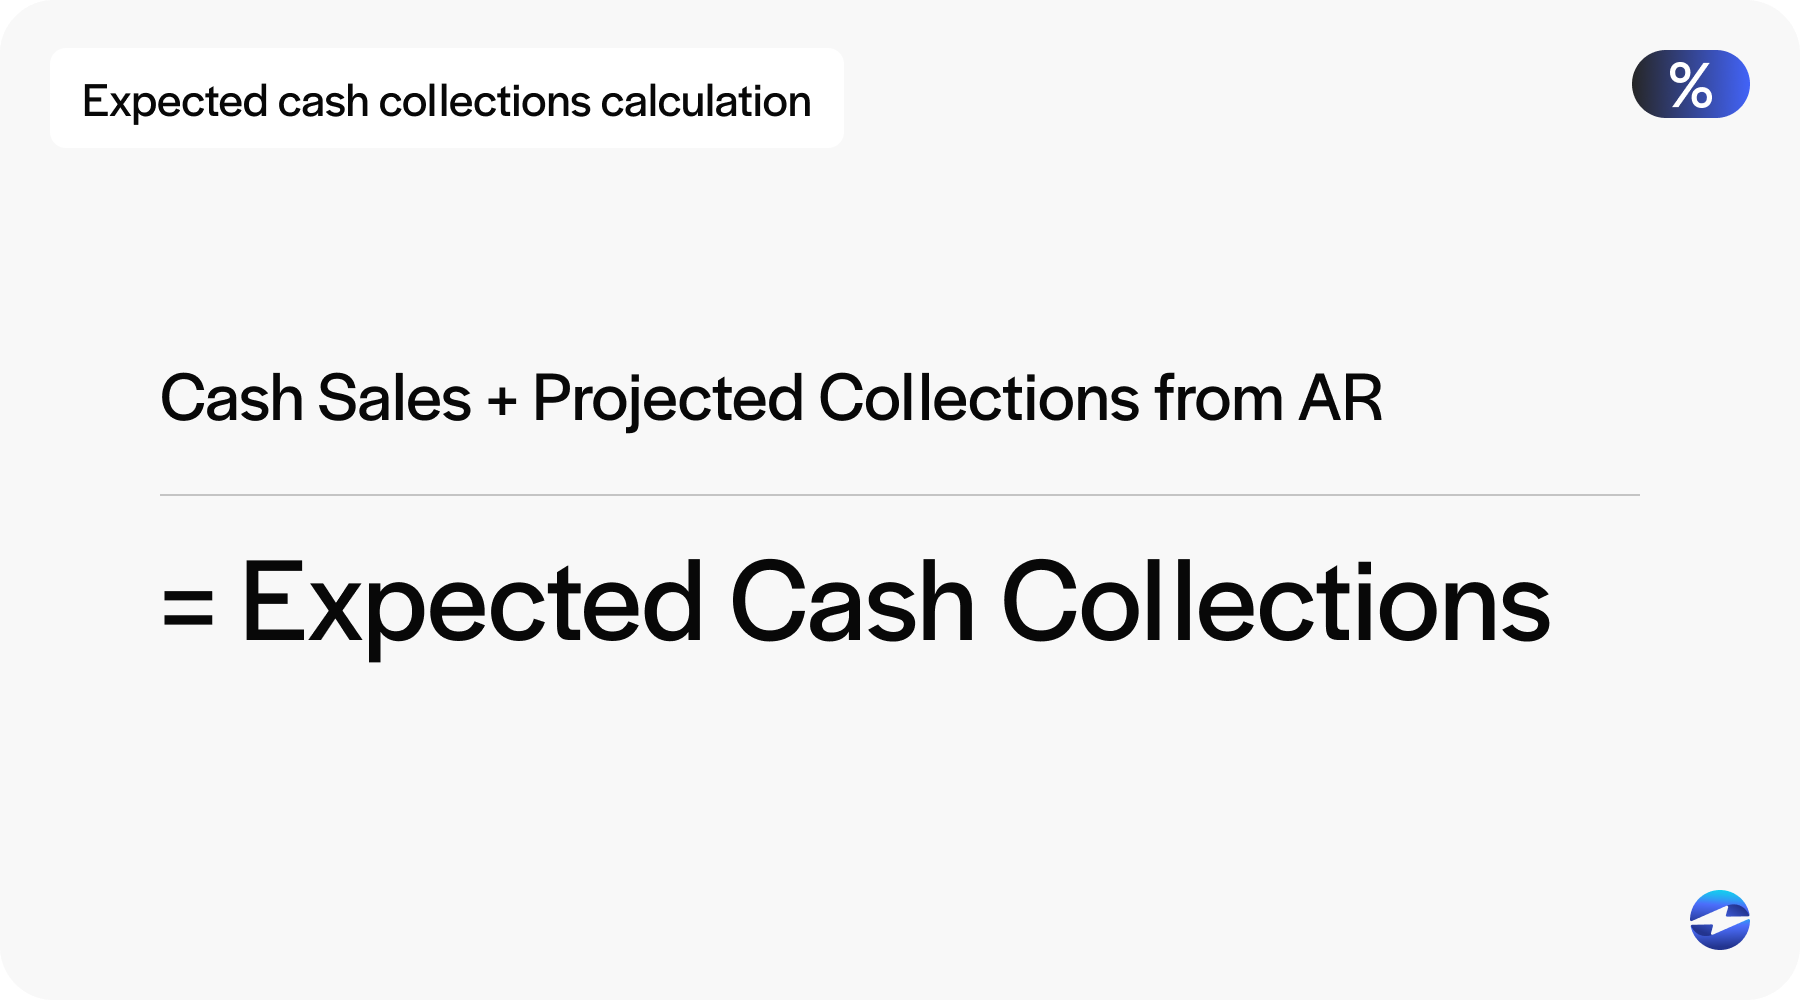
Expected Cash Collections = Cash Sales + Projected Collections from AR
Example
Let’s say a company has the following credit sales history:
- January sales: $100,000
- February sales: $80,000
- March sales: $60,000
- December sales: $90,000
The company’s collection pattern is:
- 70% of sales are collected in the month after the sale
- 20% in the second month
- 10% in the third month
To calculate expected cash collections for March, you would add:
- 70% of February sales: 0.70 x $80,000 = $56,000
- 20% of January sales: 0.20 x $100,000 = $20,000
- 10% of December sales: 0.10 x $90,000 + $9,000
Expected Cash Collections in March = $56,000 + $20,000 + $9,000 = $85,000
Based on the company’s collection history and sales data, it should expect to collect $85,000 in March from prior credit sales.
5. Average Days Delinquent (ADD)
Average days delinquent (ADD) is an AR metric that measures how many days, on average, invoices remain overdue beyond their due date.
ADD helps businesses understand how often customers make late payments and by how much. Overall, it reflects the effectiveness of a company’s ability to collect payments on time.
Why it’s important
Tracking ADD provides insights into customer payment behavior and the company’s ability to manage overdue accounts.
A rising ADD may indicate deteriorating credit control, potential cash flow issues, or a need to follow up more aggressively on unpaid invoices.
Monitoring ADD helps businesses identify late payment trends, evaluate their credit policies, improve cash flow forecasting, and take proactive steps to protect and improve cash flow.
How to calculate it
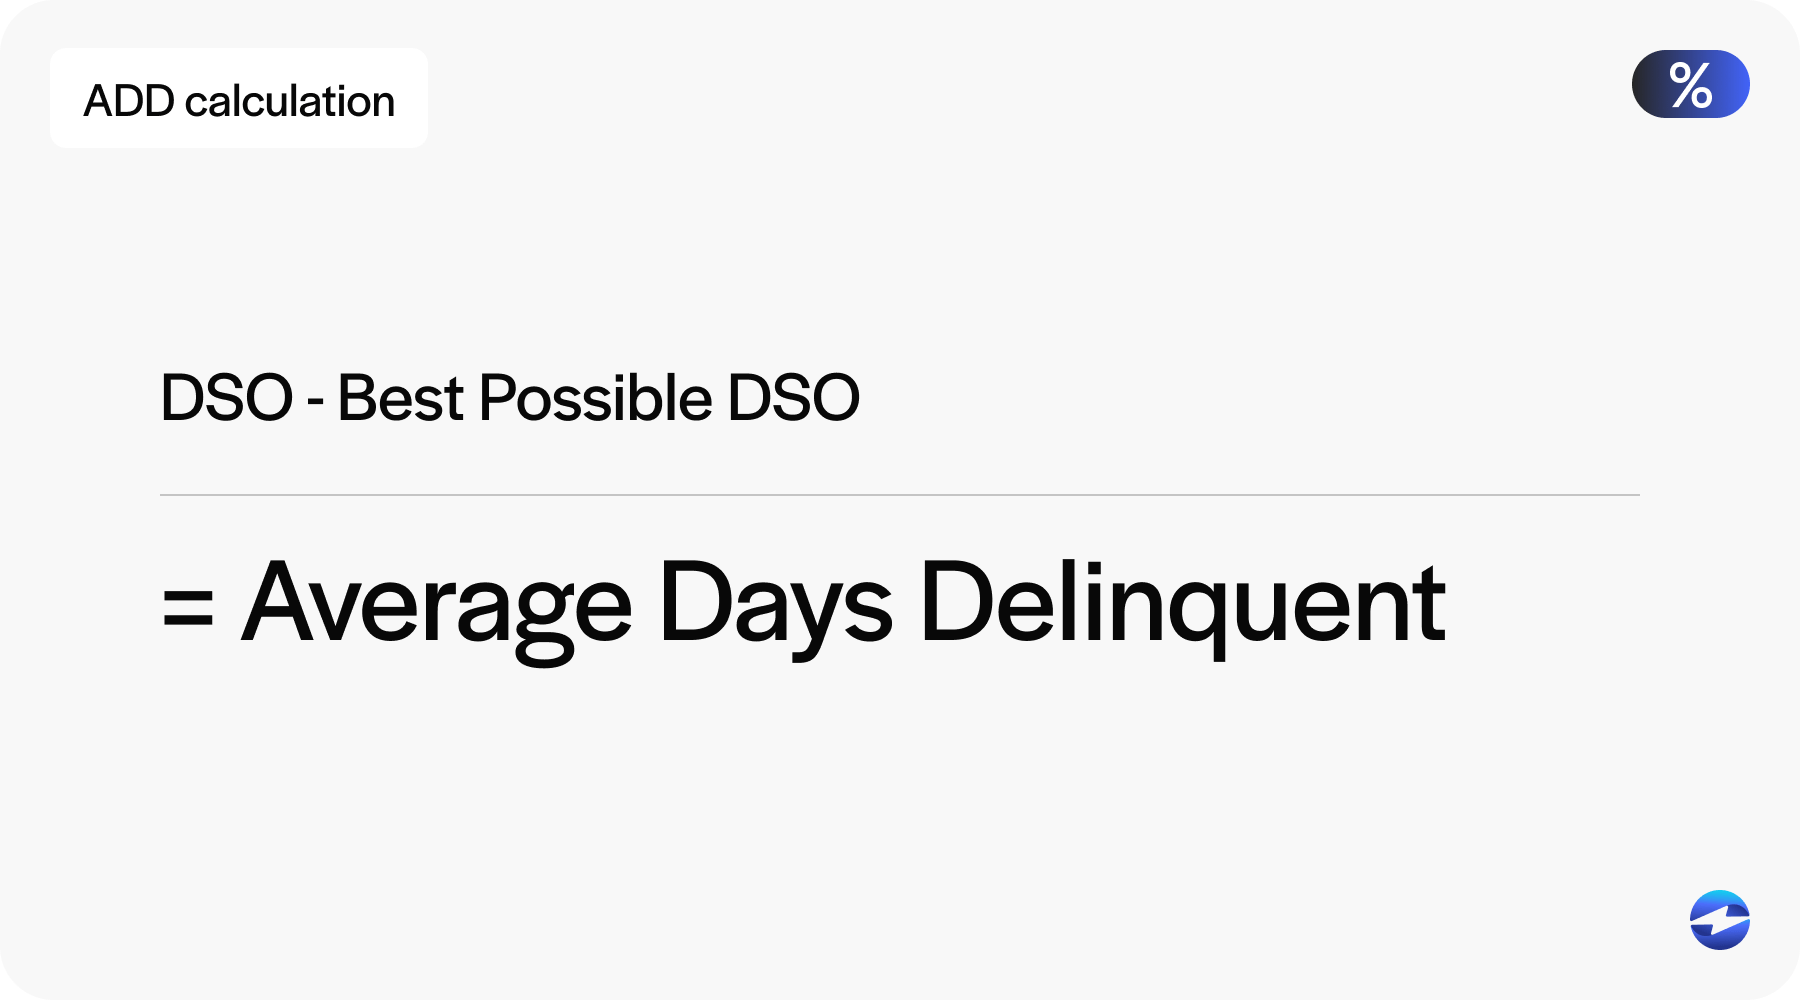
Average Days Delinquent = Days Sales Outstanding – Best Possible DSO
- DSO: The actual average number of days it takes to collect receivables
- Best possible DSO: The ideal collection time if all customers paid on time, calculated based on current credit terms and timely payments
Example
Let’s say a company has:
- DSO = 45 days
- Best possible DSO = 30 days
ADD = 45 – 30 + 15 days
This means that, on average, customers are paying 15 days late. A consistent ADD like this may indicate a need to tighten credit terms or improve collection follow-ups.
6. Collection Effectiveness Index (CEI)
The collection effectiveness index (CEI) is a performance metric that measures how effectively a company collects its AR within a specific period.

Unlike other metrics that focus on averages or timelines, CEI evaluates how much of the receivables available to be collected were actually collected.
Why it’s important
CEI is important because it gives a more accurate picture of a company’s collections than traditional metrics like DSO.
A high CEI means the business collects nearly all the money it’s owed promptly and consistently. On the other hand, a declining CEI may indicate credit policy enforcement issues or negative customer payment habits.
Tracking CEI helps companies:
- Identify gaps in the collection process
- Improve working capital management
- Pinpoint problem accounts or aging receivables
- Review collection team performance over time
How to calculate it
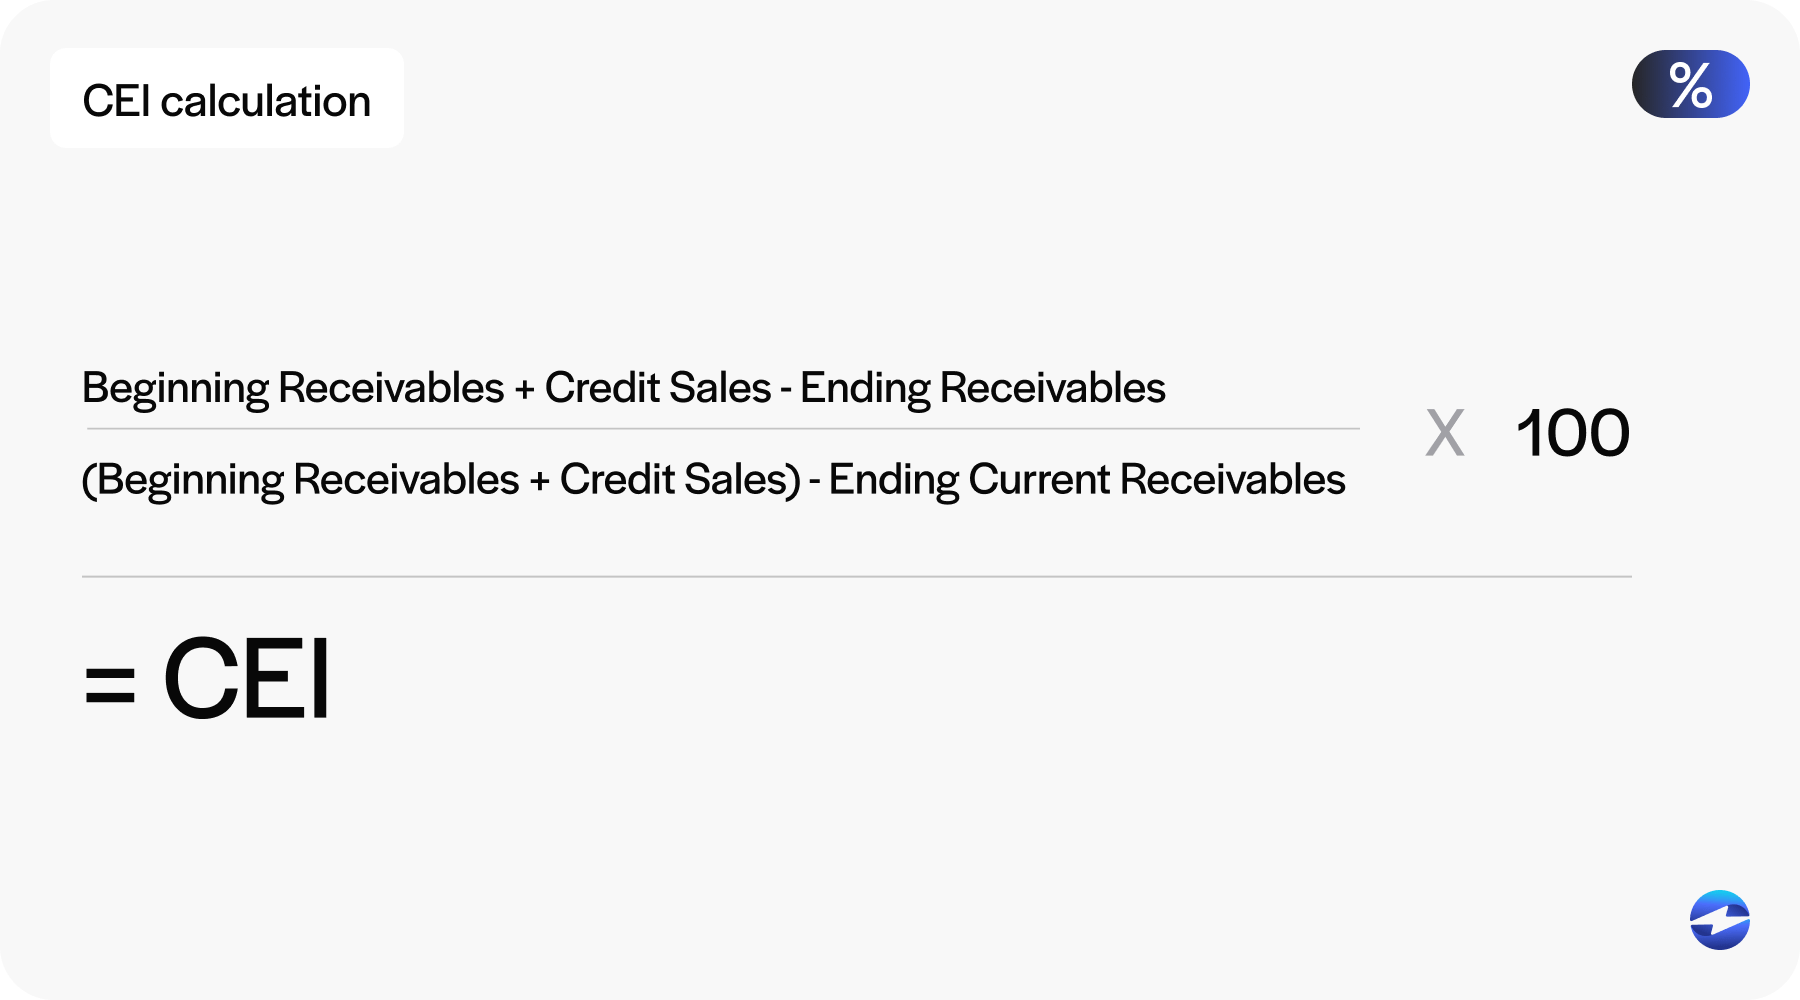
CEI = [(Beginning Receivables + Credit Sales – Ending Receivables) / (Beginning Receivables + Credit Sales) – Ending Current Receivables] x 100
- Beginning receivables: Total AR at the start of the period
- Credit sales: Sales made on credit during the period
- Ending receivables: Total AR at the end of the period
- Ending current receivables: Receivables that are still within their due date at the end of the period
Example
Say a company has the following figures for the month of March:
- Beginning receivables: $100,000
- Credit sales: $200,000
- Ending receivables: $90,000
- Ending current receivables: $40,000
CEI = [($100,000 + $200,000 – $90,000) / ($100,000 + $200,000 – $40,000)] x 100 = 80.77%
This means the company collected about 81% of the receivables during the period. While not perfect, it gives insight into where improvements can be made in collections efforts.
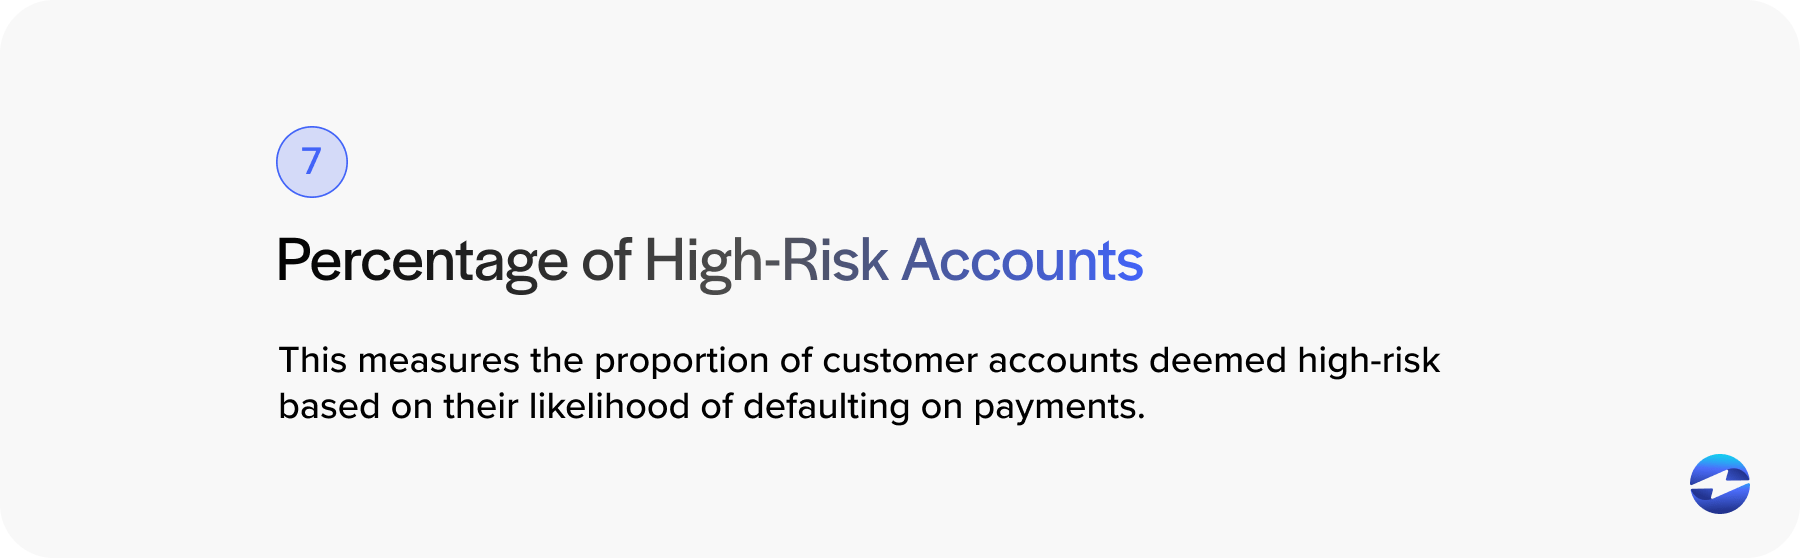
7. Percentage of high-risk accounts
The percentage of high-risk accounts measures the proportion of customer accounts deemed high-risk based on their likelihood of defaulting on payments.
High-risk accounts typically include customers with poor credit history, consistently late payments, or financial instability.
The percentage of high-risk accounts metric helps businesses understand the overall credit risk within their AR portfolio.
Why it’s important
Tracking this KPI helps businesses proactively manage credit exposure and reduce the chances of bad debt.
A high percentage of high-risk accounts may signal that the company is extending credit too freely or not screening customers effectively.
Some benefits of monitoring the percentage of high-risk accounts include better credit risk management, collections planning, and resource allocation. It also helps you identify potential cash flow problems early and make more informed decisions regarding credit policy adjustments.
Awareness of this percentage enables businesses to take preventive actions before receivables become uncollectible.
How to calculate it
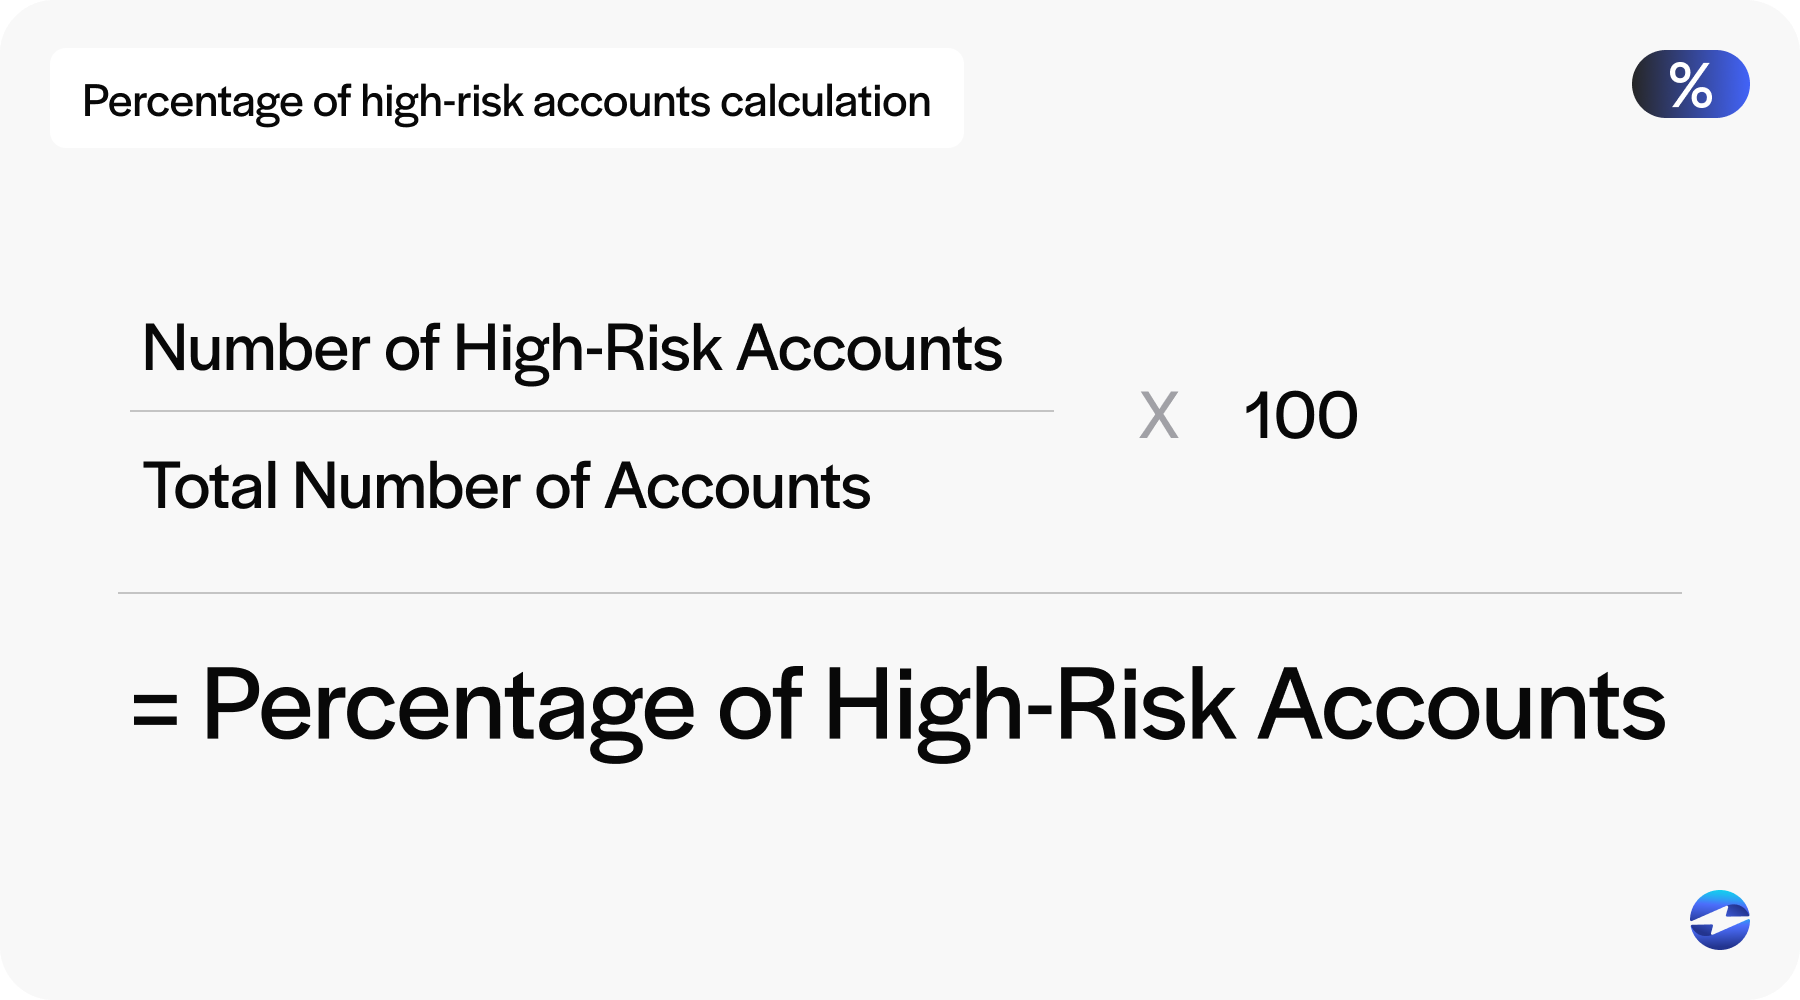
Percentage of High-Risk Accounts = (Number of High-Risk Accounts / Total number of accounts) x 100
- High-risk accounts: Accounts flagged based on specific risk criteria (credit score, payment history, financial status)
- A total number of accounts: All customer accounts with outstanding receivables
Example
Say a company has:
- 25 high-risk customer accounts
- Total of 200 active customer accounts
Percentage of high-risk accounts = (25 / 200) x 100 = 12.5%
This means 12.5% of a company’s accounts are considered high-risk. If this percentage rises over time, it may signal that the business needs to tighten credit approval processes or focus more on collections from specific customer demographics.
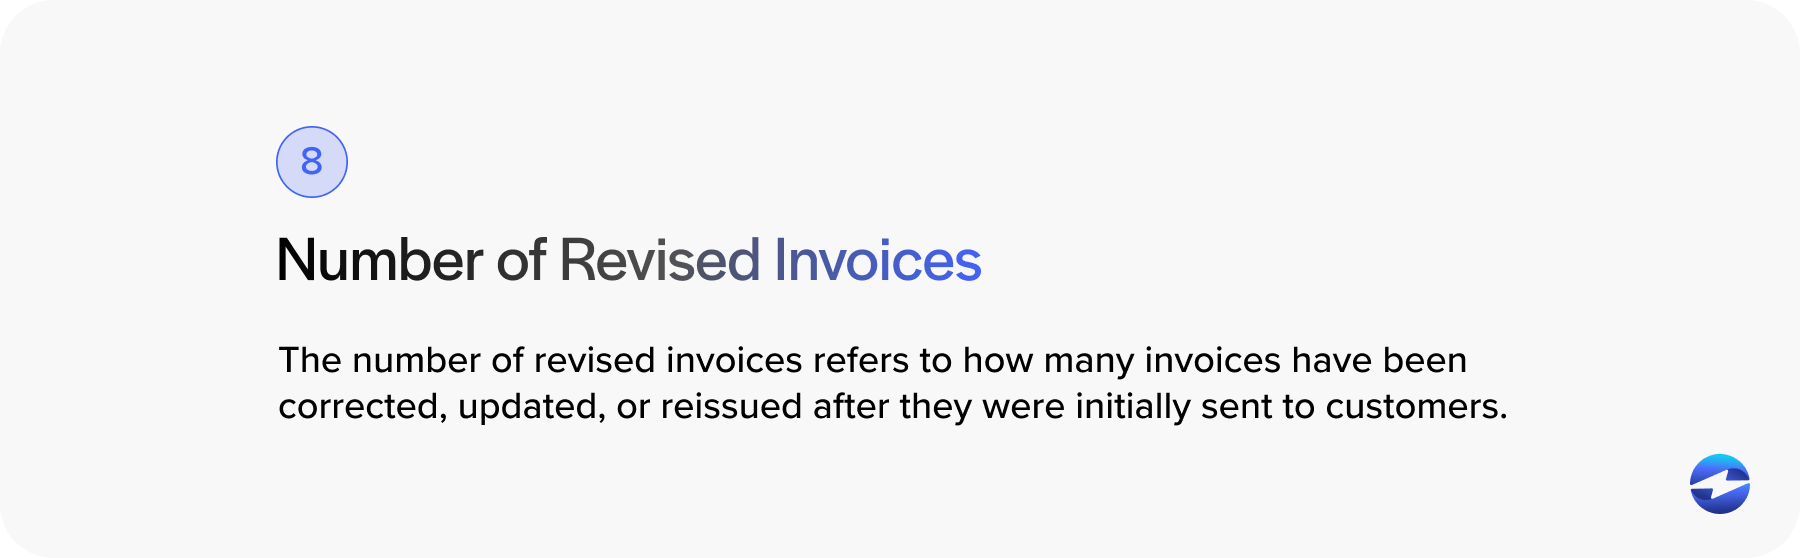
8. Number of revised invoices
The number of revised invoices refers to how many invoices have been corrected, updated, or reissued after they were initially sent to customers.
Revisions may be needed due to billing errors, incorrect pricing, wrong quantities, missing information, or customer disputes.
The number of revised invoices metric highlights potential issues in the invoicing or order fulfillment process.
Why it’s important
Tracking the number of revised invoices is important because frequent invoice corrections can:
- Delay payments, thus negatively impacting cash flow
- Erode customer trust and satisfaction
- Indicate internal process issues such as data entry errors or miscommunication between sales, billing, and fulfillment teams
By monitoring this KPI, companies can identify root causes, streamline billing processes, and reduce costly delays or disputes.
How to calculate it
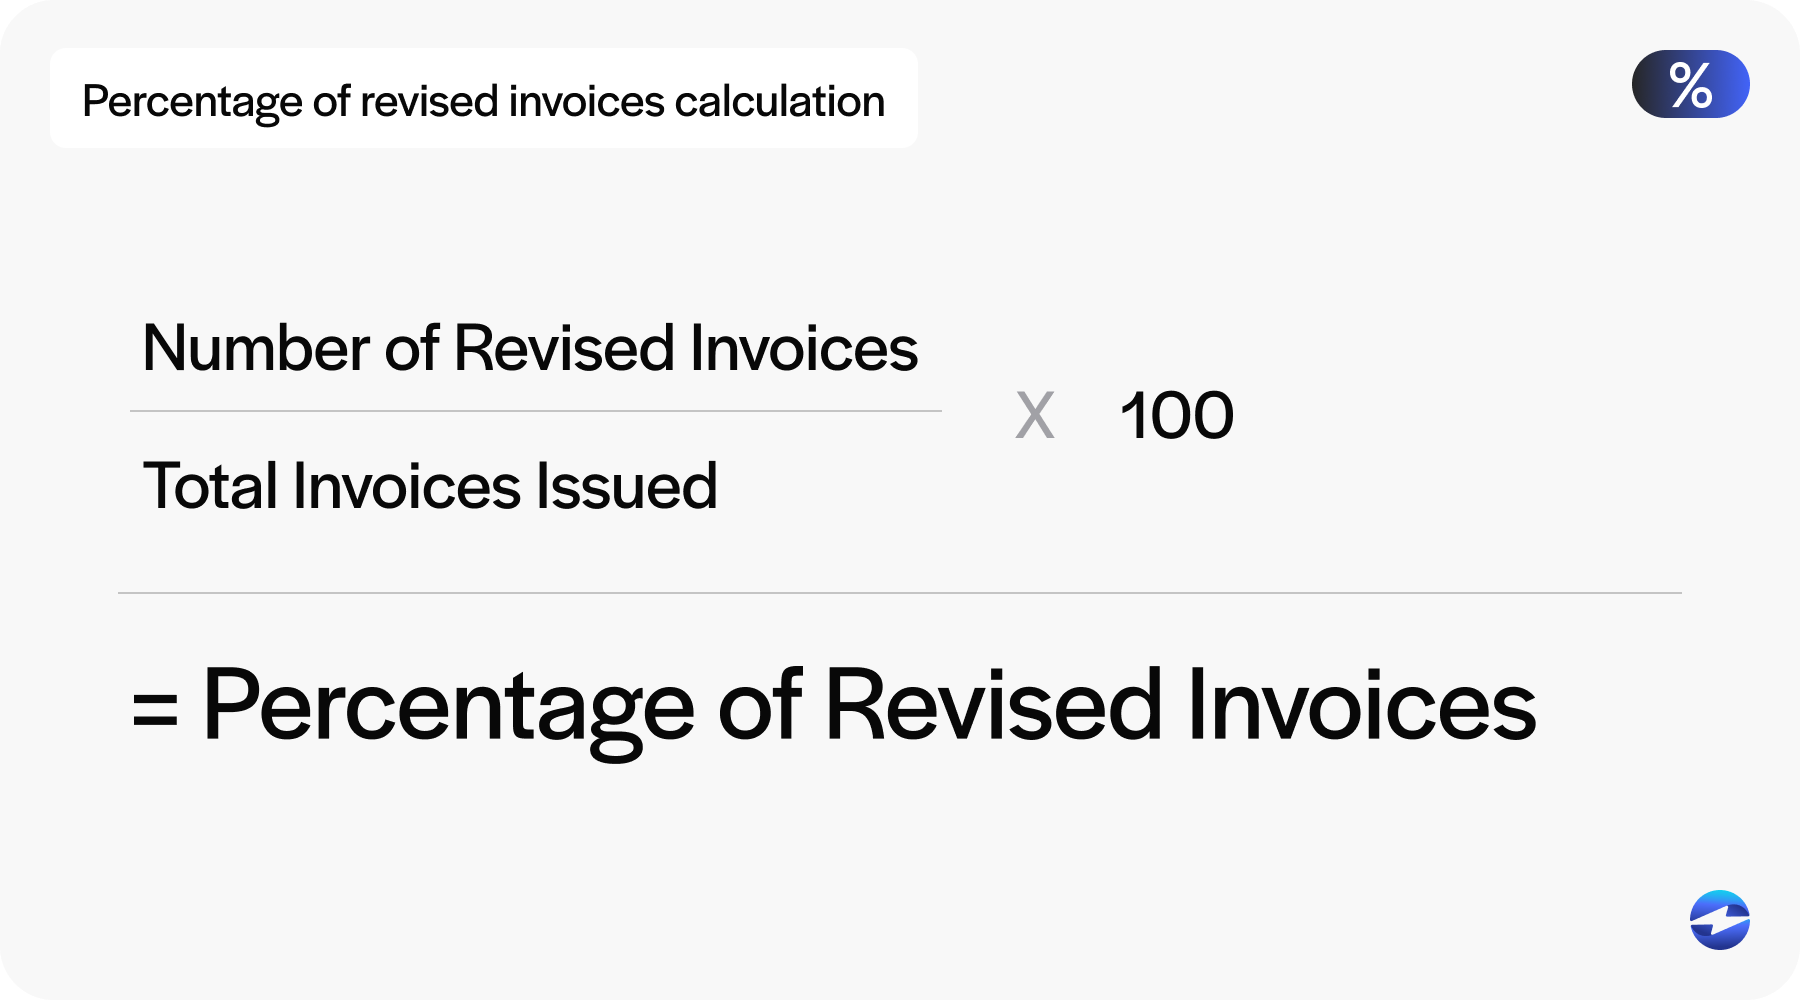
Percentage of Revised Invoices = (Number of Revised Invoices / Total Invoices Issued) x 100
Example
In the month of March:
- A company issued 500 invoices
- 25 of those invoices had to be revised due to errors
To find the percentage: Percentage of Revised Invoices = (25 / 500) x 100 = 5%
This means that 5% of the invoices issued in March required revision. While a small percentage may be acceptable, consistently high numbers can indicate a need for improvement.
9. Collection cost per invoice
Collection cost per invoice measures the average cost a company incurs to collect payment on each invoice.

This KPI can consist of all expenses related to the collections process, such as employee wages, software tools, communication efforts, legal fees, and third-party collection agency charges.
Why it’s important
Monitoring the collection cost per invoice helps you understand how well your AR processes are managed and where there may be opportunities to reduce expenses.
This metric helps businesses eliminate unnecessary expenses, enhance operations and workflows, drive more profitability to ensure costs don’t outweigh the value of products or services, and improve resource allocation.
If the collection costs are high, it can erode profit margins, especially for companies handling large volumes of low-value invoices.
How to calculate it
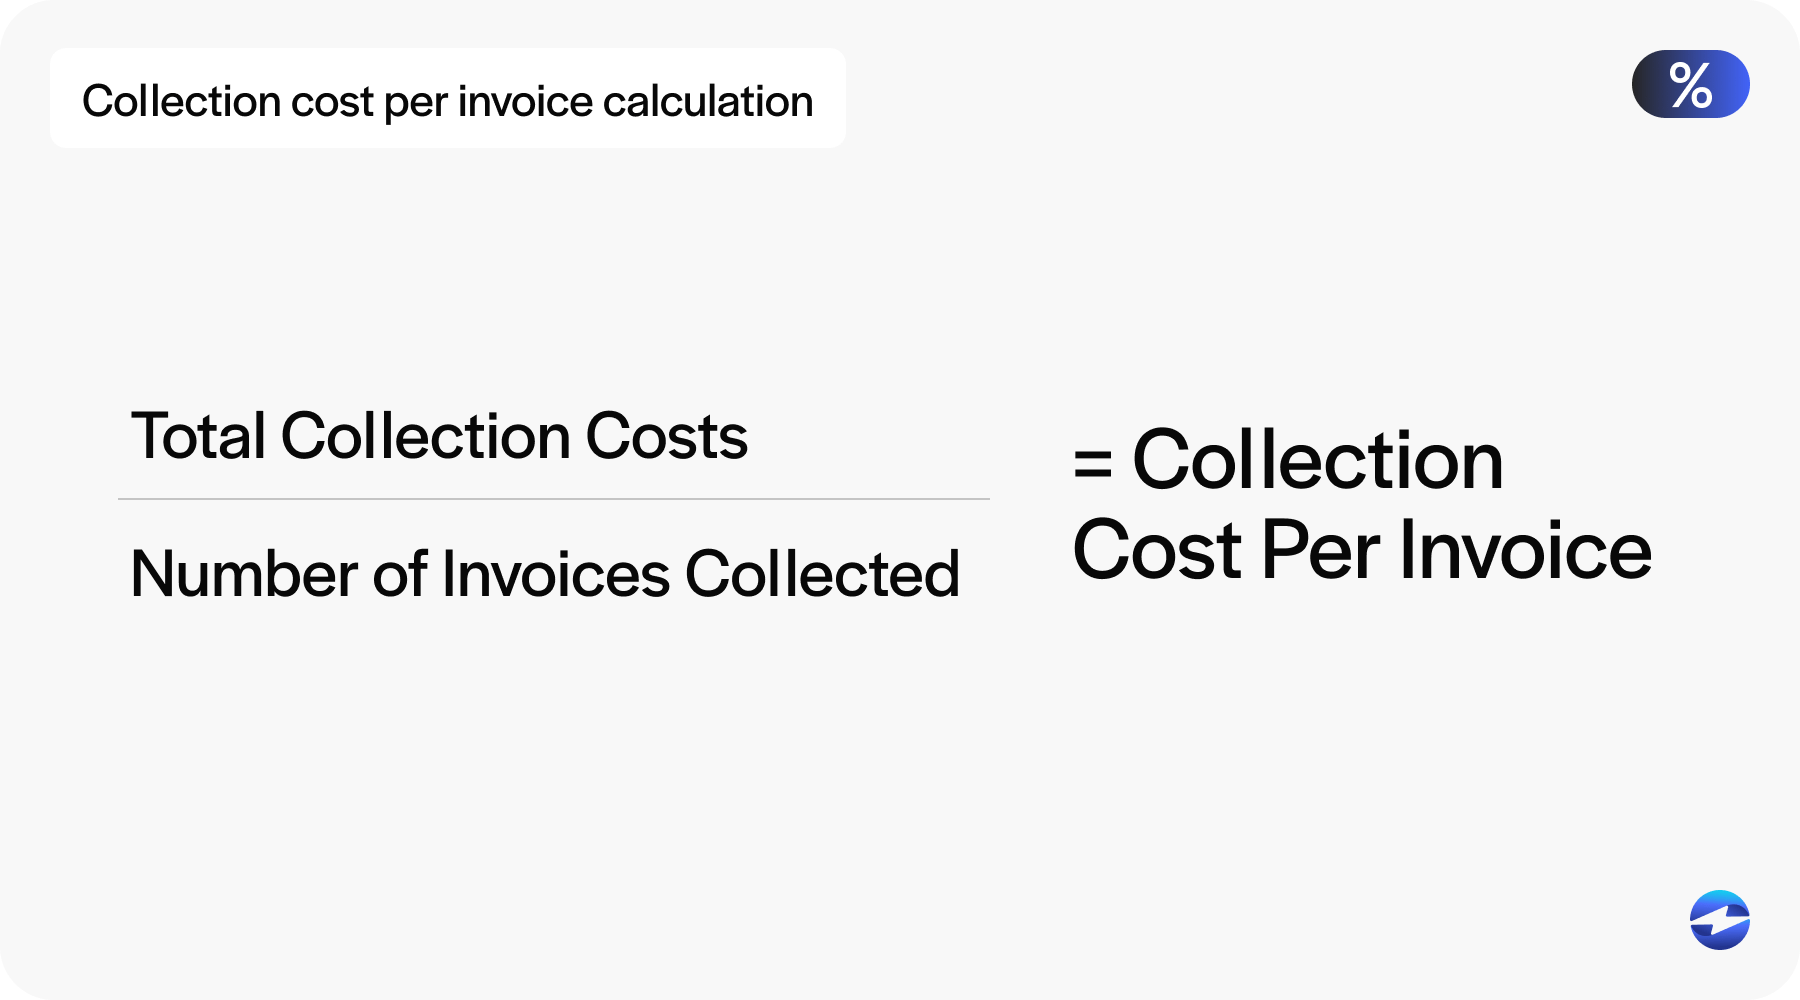
Collection Cost Per Invoice = Total Collection Costs / Number of Invoices Collected
Total collection costs: All direct and indirect costs related to collecting payments
Number of invoices collected: The total number of invoices successfully collected during a period
You can calculate collection cost per invoice on a monthly, quarterly, or annual basis, depending on your reporting needs.
Example
Let’s say in the month of March, a company incurred the following costs related to collections:
- Collections staff salaries: $6,000
- Software and automation tools: $2,000
- Communication expenses: $500
- Outsourced collection fees: $1,500
Total collection costs = $6,000 + $2,000 +$500 + $1,500 = $10,000
Now, assume the company successfully collected 1,000 invoices during the same period:
Collection Cost Per Invoice = $10,000 / 1,000 = $10
This means it costs the company $10 on average to collect each invoice. If that number seems high relative to the invoice value, it may be time to automate processes or reevaluate your collections strategy.
10. Payment terms compliance rate
The payment terms compliance rate measures the percentage of customers who pay their invoices on or before the agreed-upon due date.
This KPI reflects how well customers adhere to the payment terms set by the business, such as Net 30 or Net 60.
Why it’s important
Tracking the payment terms compliance rate is essential because it directly impacts cash flow, financial planning, and customer relationship management.
Payment terms compliance rate aids businesses in:
- Improving cash flow predictability
- Highlighting customer payment behavior trends
- Reducing the risk of late payments and bad debt
- Identifying accounts needing closer follow-up or stricter credit terms
- Supporting operational planning and working capital management
A high compliance rate means most customers pay on time, while a low rate can indicate systemic issues or at-risk accounts.
How to calculate it
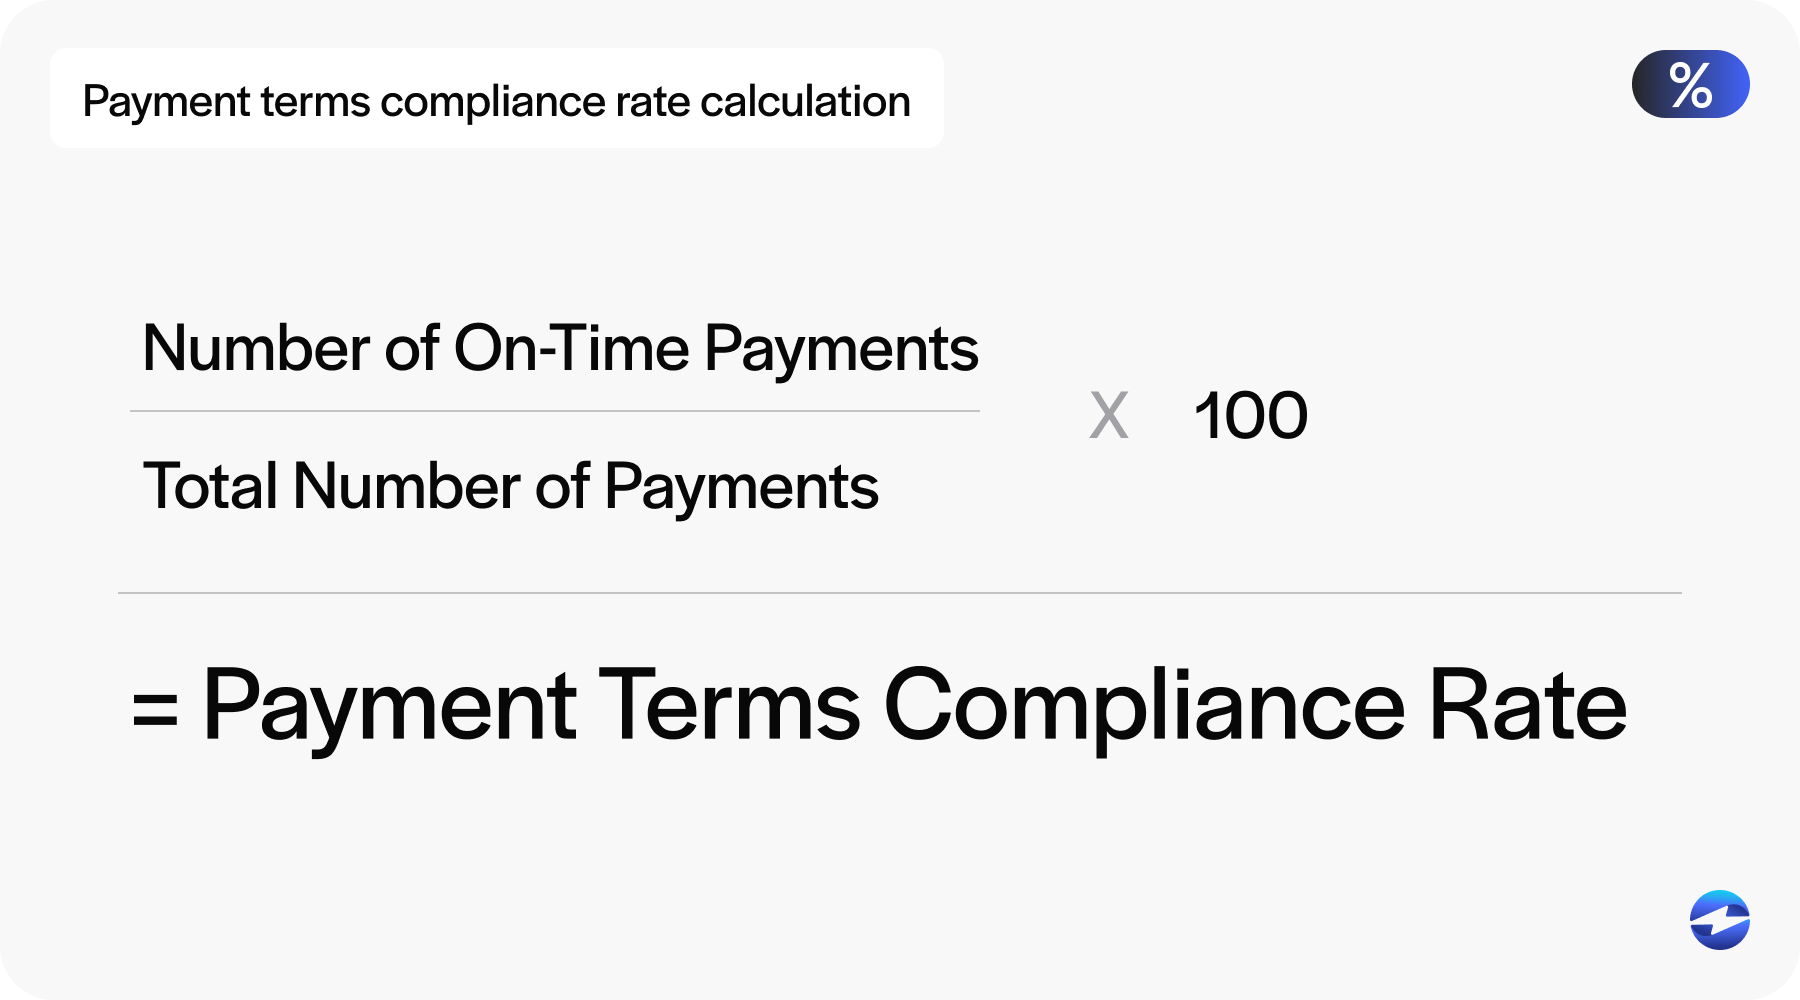
Payment Terms Compliance Rate (%) = (Number of On-Time Payments / Total number of payments) x 100
- On-time payments: Invoices paid by or before the due date
- Total Payments: All invoices that were paid during the reporting period
You can calculate this monthly, quarterly, or annually depending on your business needs.
Example
Let’s say a company processed 500 payments in a month. Out of those, 425 were paid on or before the due date.
Payment Terms Compliance Rate = (425 / 500) x 100 = 85%
This means the company has an 85% compliance rate with payment terms, which suggests that most customers pay on time. If this number drops over time, it can be a sign to revisit credit policies, send earlier payment reminders, or follow up more proactively.
11. Credit utilization ratio
The credit utilization ratio measures how much of a company’s or individual’s available credit is being used. It’s commonly used in both business and personal finance to assess credit health and risk.

The ratio compares outstanding credit balances to total available credit limits, showing how reliant a company is on borrowed funds at any given time.
Why it’s important
Tracking the credit utilization ratio reflects credit management practices and affects financial health in several ways:
- Creditworthiness: A high ratio can signal financial strain or over-reliance on credit, which may negatively affect credit scores.
- Cash flow management: Businesses with high utilization may face liquidity issues or limited access to additional credit.
- Lender decisions: Lenders often assess this ratio when deciding whether to extend or increase credit lines.
- Risk exposure: It helps businesses monitor their leverage and avoid overextension.
A lower ratio generally indicates better credit health and a stronger ability to repay debts.
How to calculate it
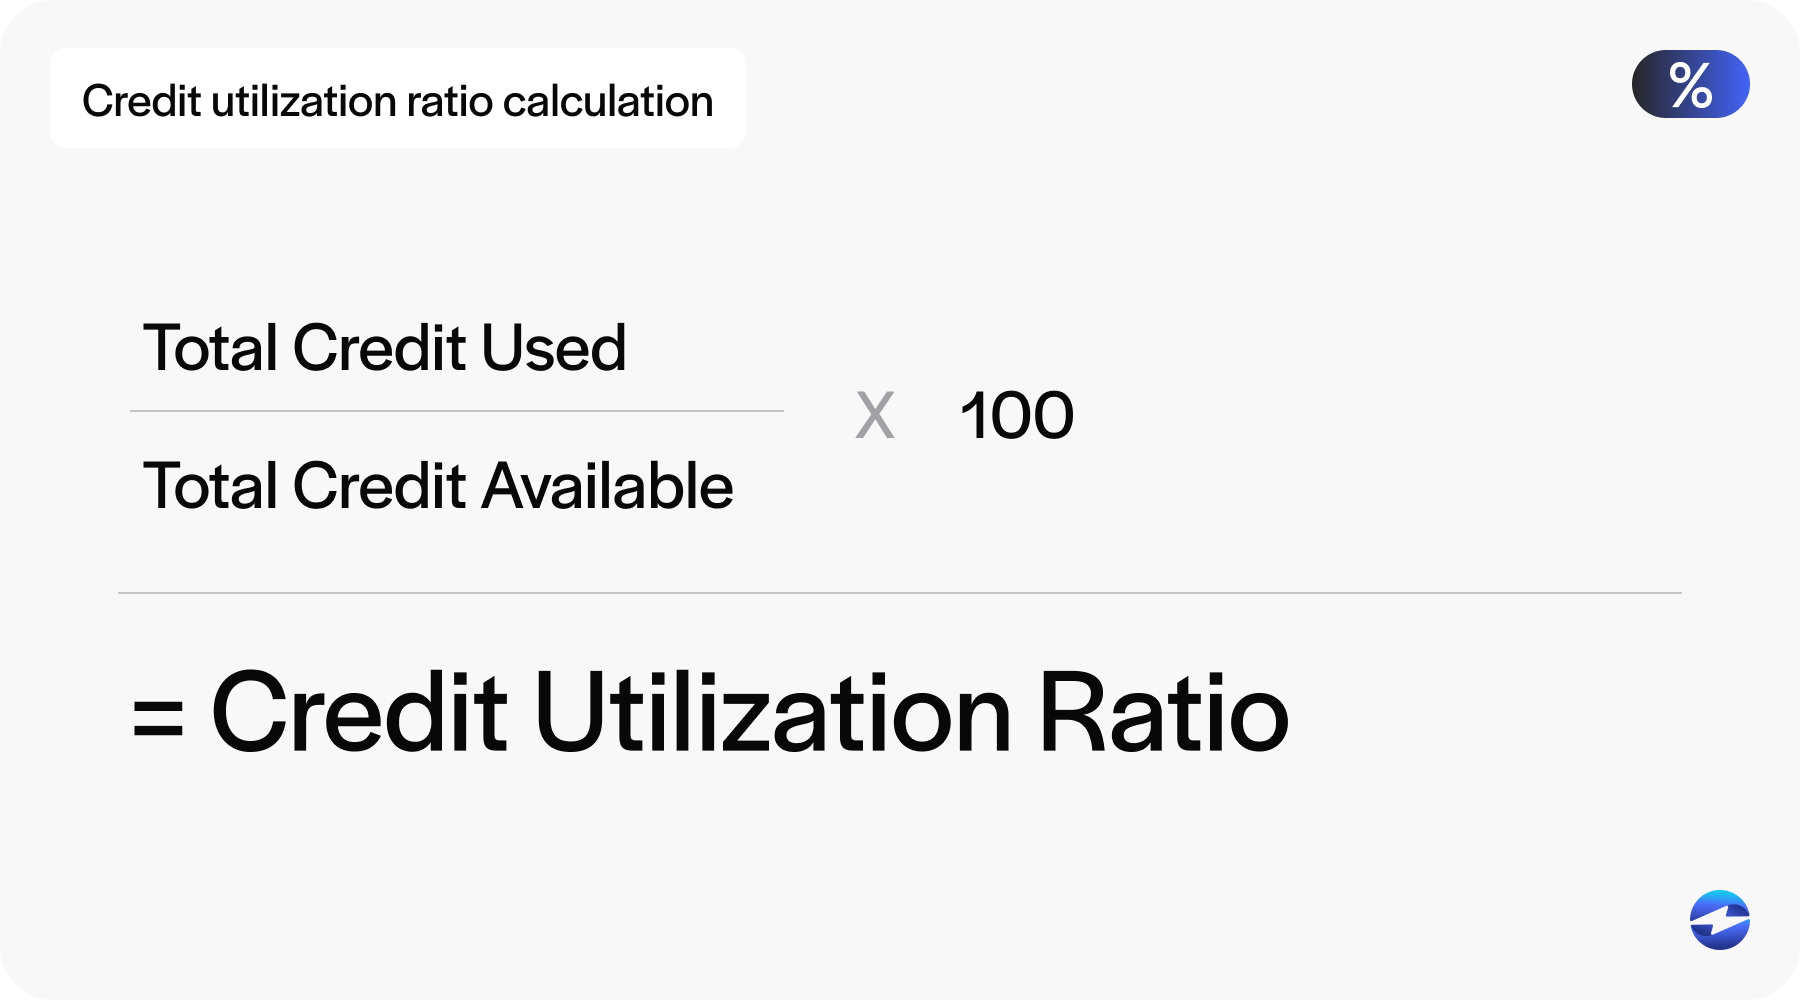
Credit Utilization Ratio = (Total Credit Used / Total Credit Available) x 100
Example
Let’s say a business has:
- $40,000 in outstanding credit card and credit line balances
- $100,000 in total credit limits across all accounts
Credit Utilization Ratio = ($40,000 / $100,000) x 100 = 40%
This means the company is using 40% of its available credit. While this may be acceptable in some cases, financial experts typically recommend keeping the ratio below 30% to maintain a strong credit profile and reduce financial risk.
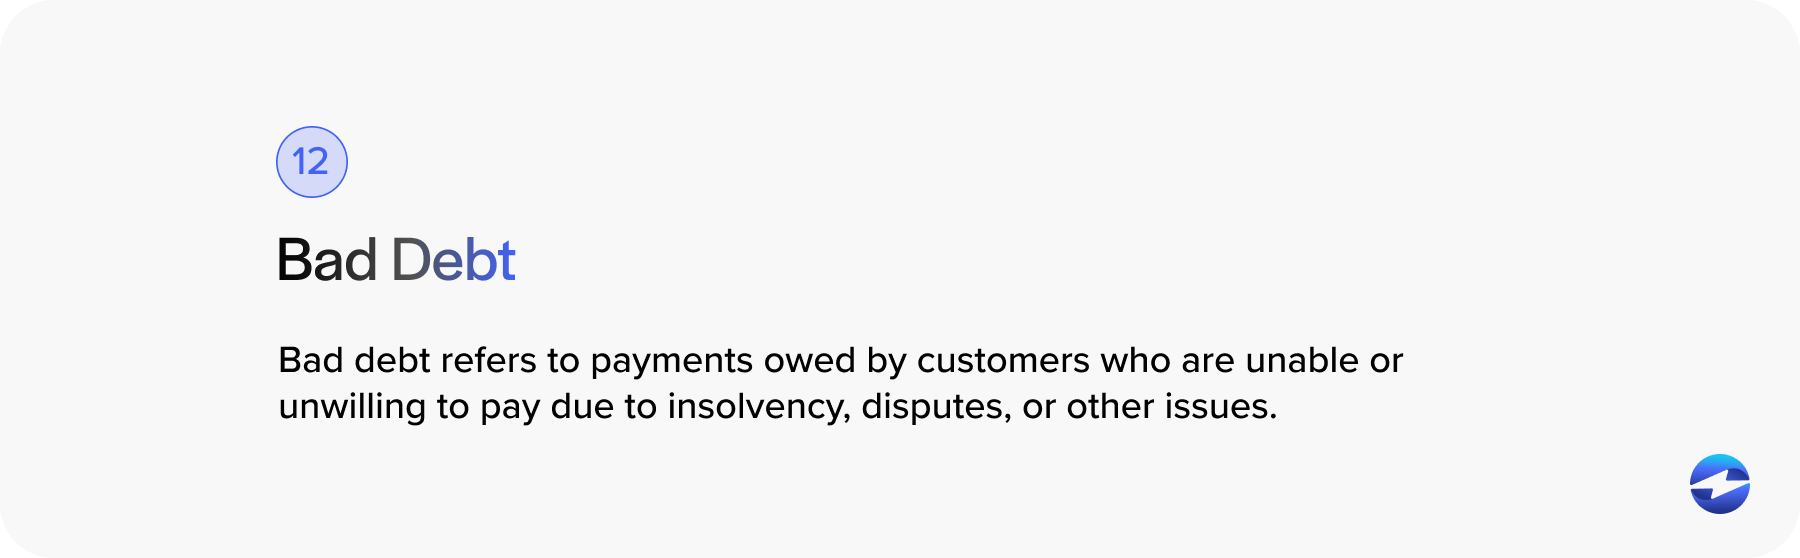
12. Bad debt
Bad debt refers to payments owed by customers who are unable or unwilling to pay due to insolvency, disputes, or other issues.
Once identified as uncollectible, bad debt is typically written off as an expense on the company’s income statement.
Why it’s important
Tracking bad debt is essential because it directly impacts a company’s financial health and profitability.
High levels of bad debt can reduce net income, distort cash flow forecasting, indicate poor credit risk management or collections, diminish investor confidence, and hinder financial reporting accuracy.
Monitoring bad debt helps businesses make better decisions about credit policies, customer screening, and collections strategies.
How to calculate it
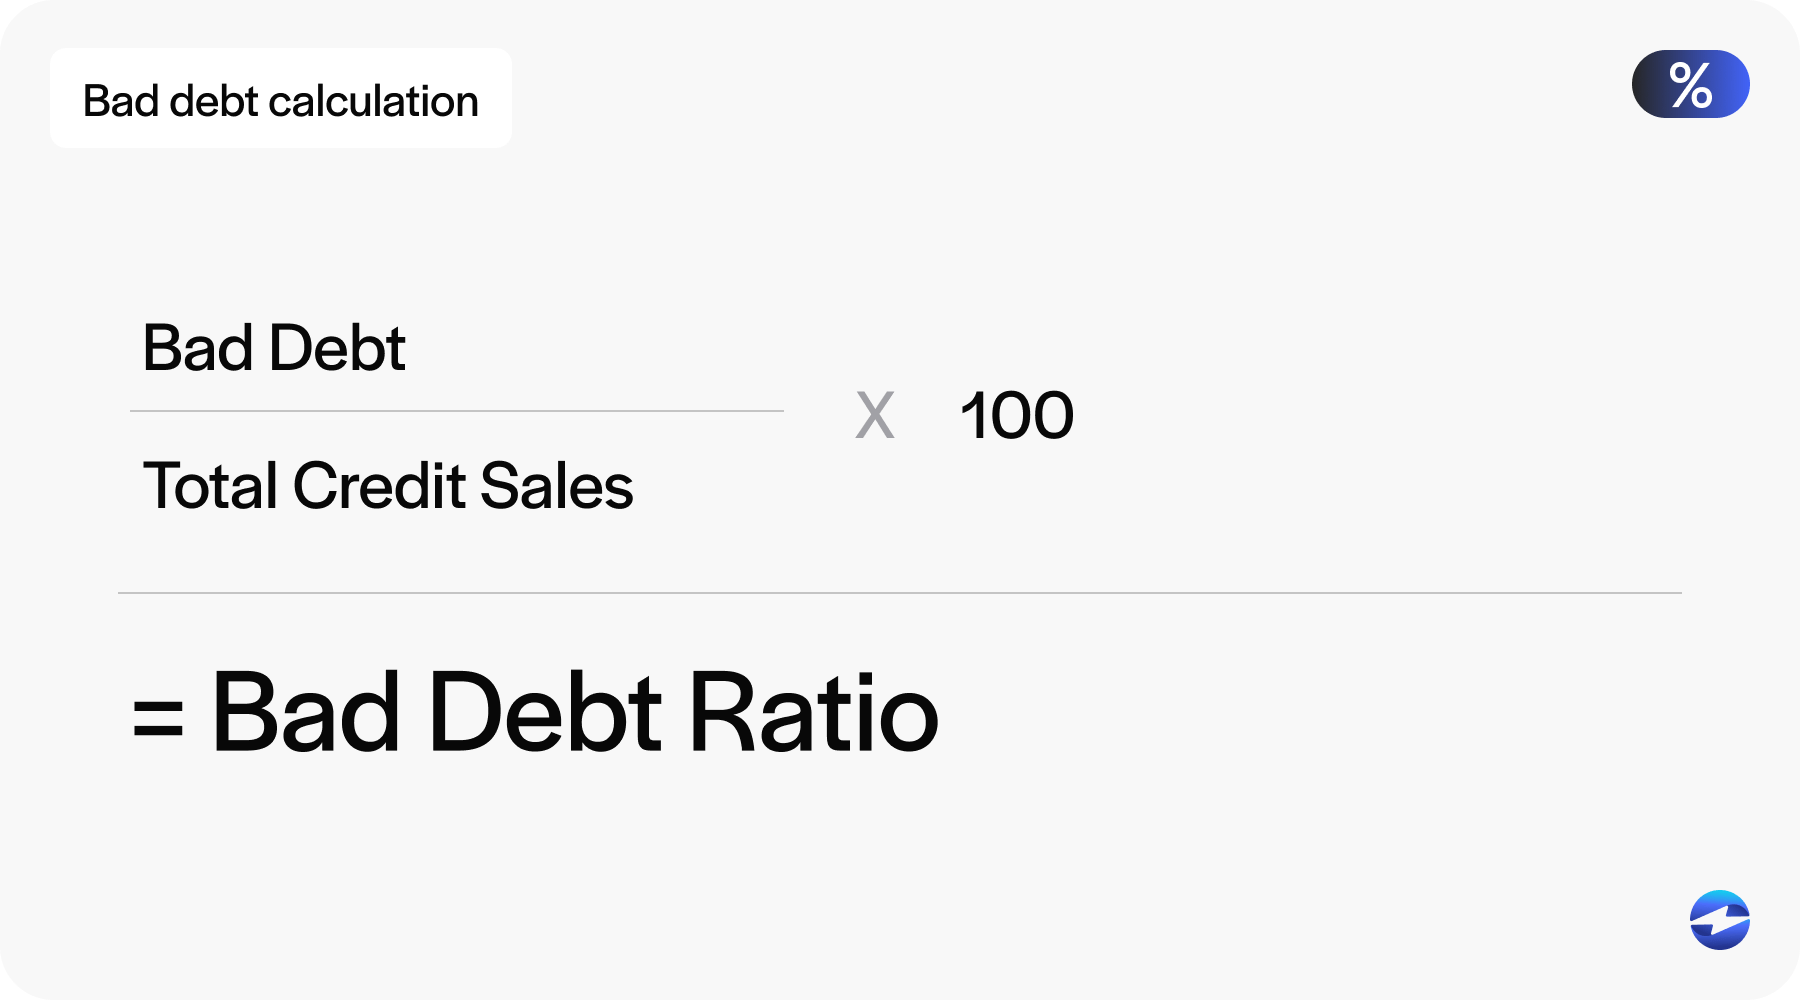
Bad Debt Ratio = (Bad Debt / Total Credit Sales) x 100
- Bad debt: The portion of AR a company deems uncollectible and writes off as a loss
- Total credit sales: Refers to the total value of sales made on credit (not paid in cash) during a specific period
Example
Let’s say in Q1, a company made:
- $500,000 in total credit sales
- Wrote off $15,000 as bad debt
Bad debt ratio = ($15,000 / $500,000) x 100 = 3%
This means 3% of the company’s credit sales for that quarter weren’t collected. If this percentage increases over time, a business may need to revise its credit approval or collections process.
13. Staff productivity
Staff productivity is a performance metric that measures the efficiency and output of employees relative to the resources (time, effort, or cost) they consume.

By reviewing internal productivity, your business can assess how effectively staff contribute to the company’s goals. Staff productivity can be measured by revenue generation, task completion, service delivery, and other areas.
In accounting or finance departments, staff productivity may focus on metrics like invoices processed, accounts closed, or collections completed per employee.
Why it’s important
Actively monitoring staff productivity will give businesses a better idea of their internal day-to-day operations and help them:
- Improve operational efficiency
- Optimize resource allocation and staffing decisions
- Identify high performers and training needs
- Reduce costs and increase output with the same or fewer resources
- Align employee performance with organizational goals
Consistent low productivity may indicate problems with operational and project management, workload distribution, software or hardware tools, or employee engagement.
How to calculate it

Staff productivity = Output / Input
- Output: Tasks completed, revenue generated, or units produced
- Input: Hours worked, number of employees, or cost of labor
Example
Suppose a billing team of four employees processes 2,000 invoices in a month. You can calculate productivity as:
Staff productivity = 2,000 invoices / 4 employees = 500 invoices per employee
This means each team member processed an average of 500 invoices during the month. You can then track this metric over time or compare it to industry benchmarks to gauge performance.
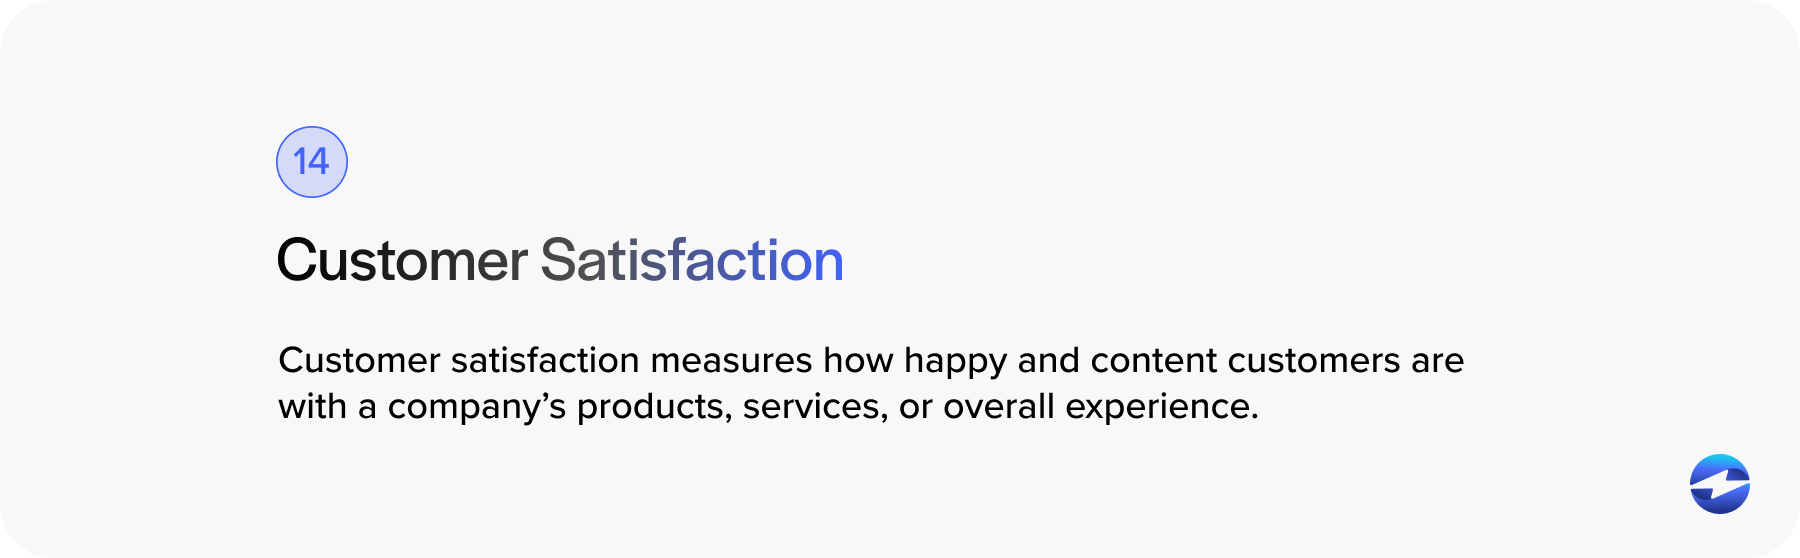
14. Customer satisfaction
Customer satisfaction measures how happy and content customers are with a company’s products, services, or overall experience. It reflects how well a business meets or exceeds consumer and industry expectations.
Customer satisfaction is often captured via direct feedback, surveys, reviews, or support interactions.
High customer satisfaction typically leads to return purchases, more positive word-of-mouth recommendations or reviews, and enhanced brand loyalty.
Why it’s important
Tracking customer satisfaction is essential for long-term business success because it can lead to a better overall brand reputation, thus driving more revenue.
Customer satisfaction can drive more customer retention and loyalty, increase lifetime value and referrals, pinpoint areas of improvement, improve market standings, and reduce churn and negative reviews.
How to calculate it
One of the most common methods for calculating this KPI is using the customer satisfaction score (CSAT), which uses a short customer survey to rate their satisfaction on a scale.
Here’s the basic CSAT formula:
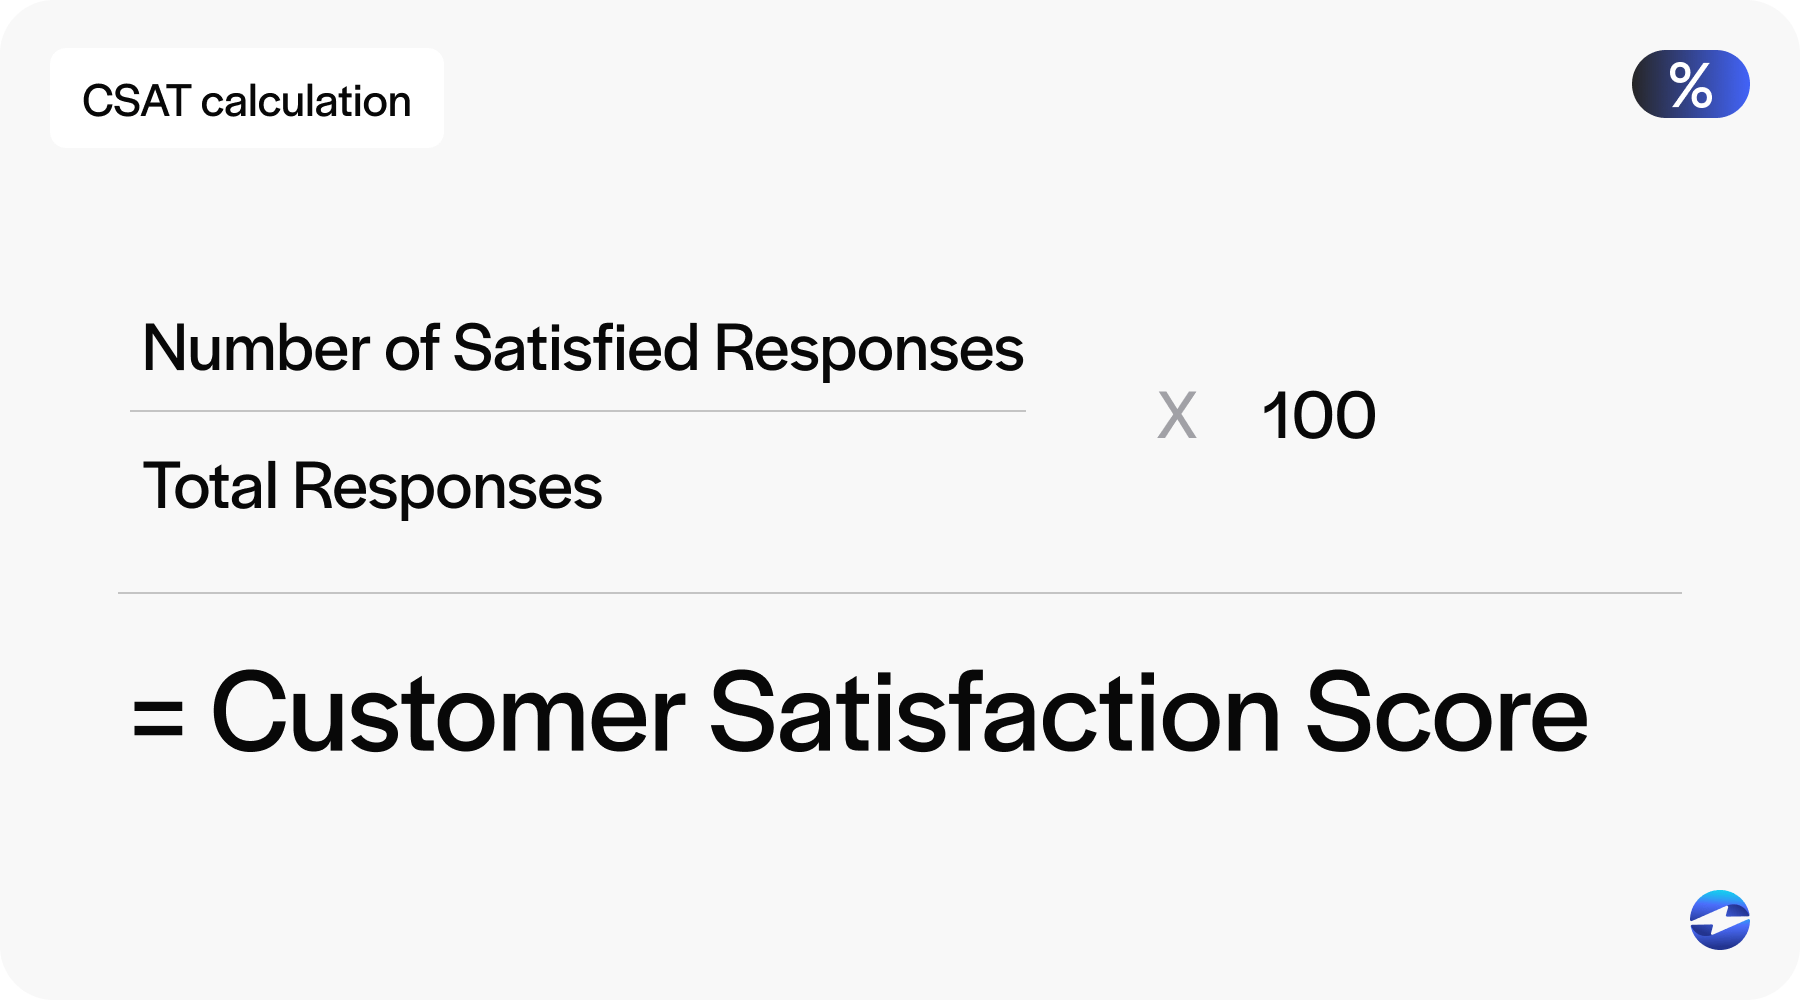
CSAT (%) = (Number of Satisfied Responses / Total Responses) x 100
- Satisfied responses: Responses rated as 4 or 5 on a 5-point scale (or 8-10 on a 10-point scale)
- Total responses: All survey responses collected
Example
A company surveys 200 customers after a support interaction and receives the following ratings:
- 160 customers gave a rating of 4 or 5 on a 5-point scale
- 40 customers gave lower ratings
CSAT = (160 / 200) x 100 = 80%
This means the company has an 80% customer satisfaction rate, indicating that 4 out of 5 customers were happy with their experience.
By prioritizing these 14 KPIs, your business can strengthen its internal operations while building lasting customer relationships and long-term business success.
How EBizCharge can improve KPI tracking and AR operations
Merchants can work with a reliable payment processor like EBizCharge to enhance KPI management and transform customer payments.
EBizCharge is a powerful payment processing software equipped with robust AR management tools that simplify and automate the collections process. This frees up time and resources for your company to thoroughly review its KPIs and improve its revenue.
With features like real-time reporting, customizable dashboards, and over 100 seamless accounting/ERP integrations, EBizCharge makes it easier to track KPIs like DSO, payment terms compliance, and collection costs – giving teams the visibility they need to make informed decisions and improve cash flow.
Prioritizing the right KPIs
Prioritizing the proper accounts receivable KPIs empowers your AR team to work more efficiently, reduce risk, and support a steady revenue stream.
By proactively tracking these metrics, your business can uncover valuable insights, mitigate or eliminate financial or productivity gaps, and optimize its collection strategies.
By proactively tracking these metrics using an accounts receivable template or integrating with an accounting solution like EBizCharge, your business can uncover valuable insights. This approach helps eliminate financial or productivity gaps and optimize your collection strategies.
Whether focused on boosting customer satisfaction or minimizing bad debt, these KPIs provide a data-driven foundation for making smarter financial decisions and achieving long-term success.

