Blog > Accounts Receivable Automation ROI: What to Expect and How to Calculate It
Accounts Receivable Automation ROI: What to Expect and How to Calculate It
AR automation ROI is one of those topics where the numbers are well documented but rarely organized in a way a finance committee will engage with. This article gives you a defensible framework and a simple calculator. The structure: cost of the status quo, where savings come from, the math itself, and how vendor pricing changes the payback timeline.
What manual AR actually costs
Most teams underestimate the cost of manual accounts receivable because they only count the obvious labor line. Pricing the cost of manual accounts receivable correctly is the foundation of the rest of the model, so it’s worth slowing down here.
FTE time is the biggest bucket. AR clerks typically spend 50 to 70 percent of their day on cash application, remittance matching, and dispute research. A manual operator processes 200 to 400 invoices a day, and an automated workflow handles 1,500 or more without adding headcount.
Error correction is the second bucket. Misapplied payments run 1 to 3 percent of transactions in manual shops. Each one takes 15 to 30 minutes to resolve, and the downstream effect on customer trust shows up in slower repeat payments.
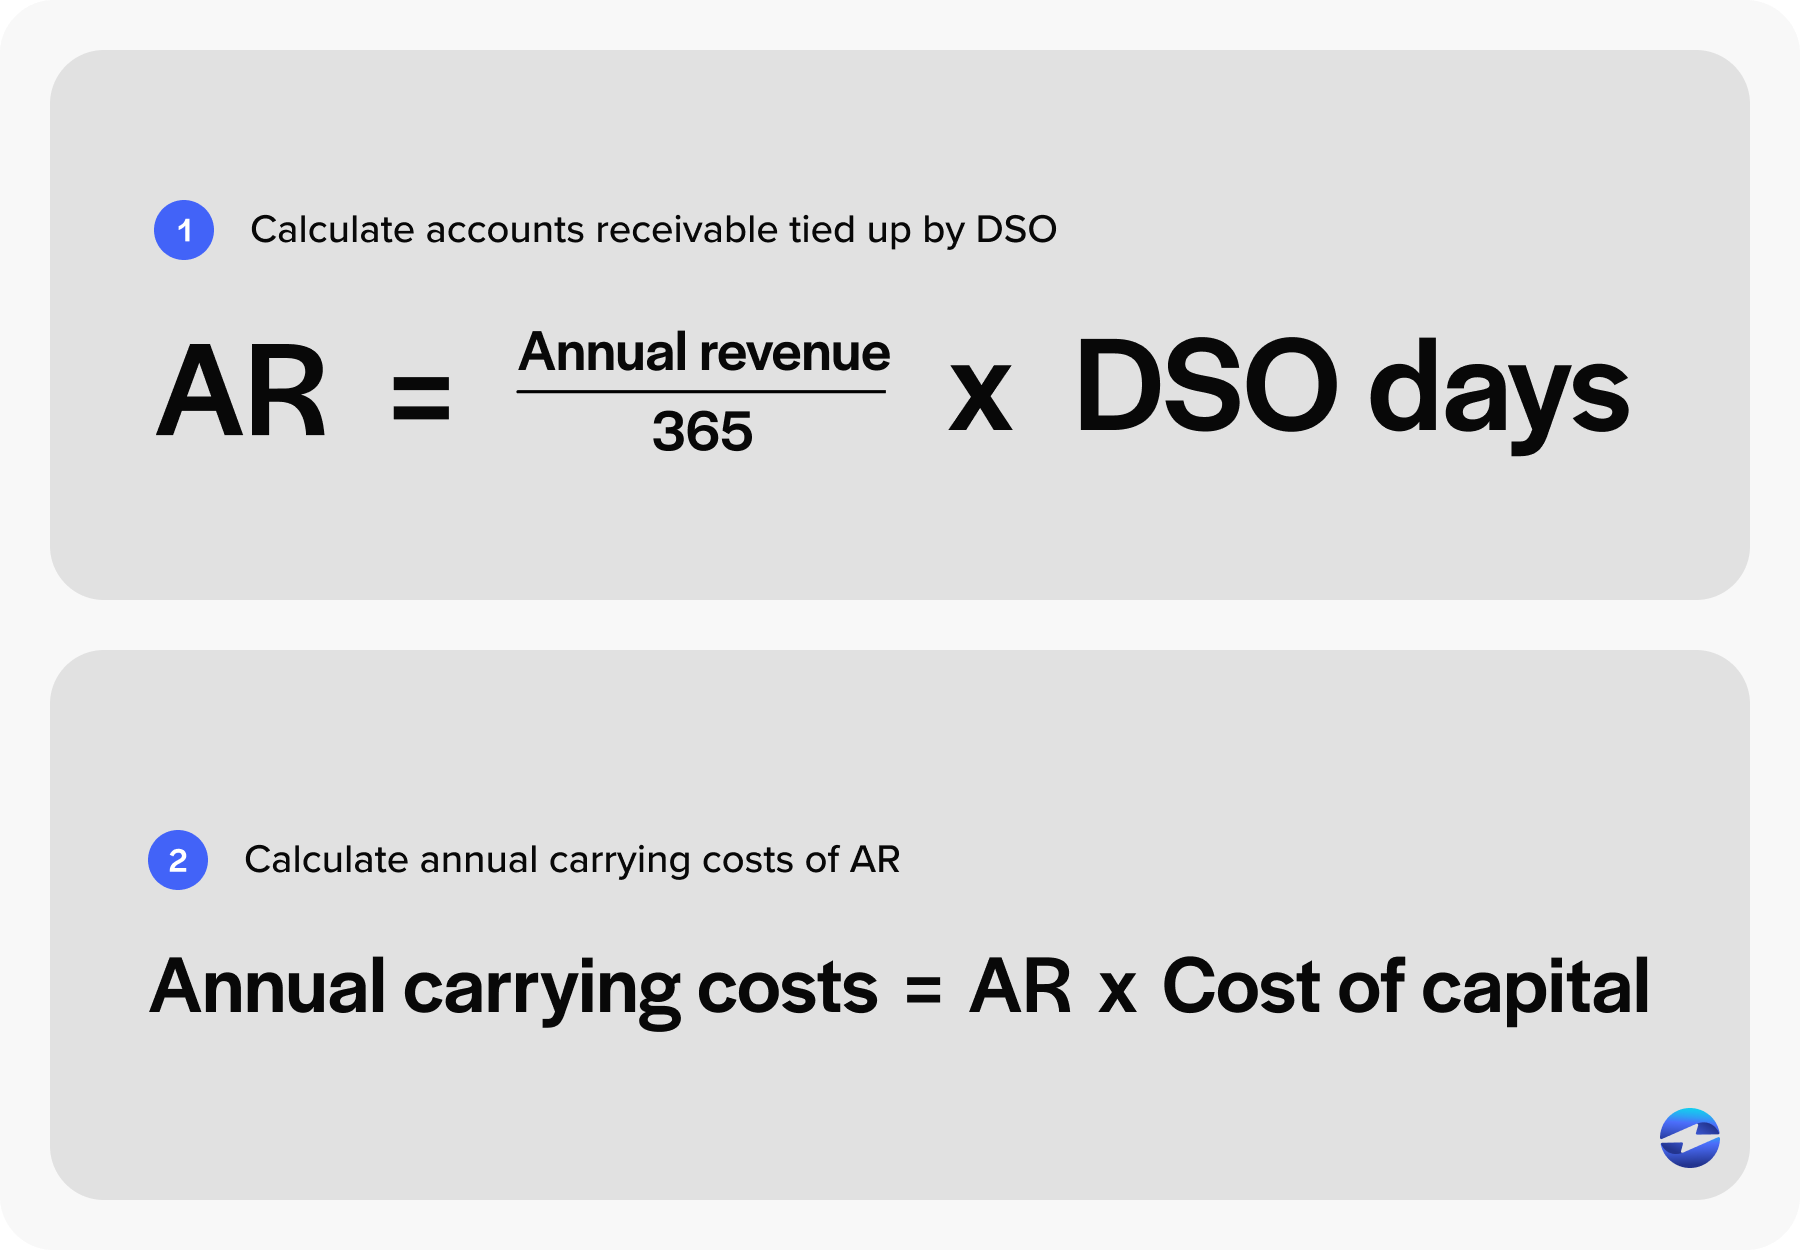
Then there’s the working capital cost of days sales outstanding (DSO). Every day of DSO ties up cash. The formula is simple: annual revenue divided by 365, multiplied by DSO days, equals working capital locked in receivables. Multiply that by your cost of capital, and you have the annual carrying cost of slow collections.
Bad debt and write-offs round out the picture. Manual operations typically write off 1 to 2 percent of revenue. Automated operations cut that closer to 0.3 to 0.5 percent.
Where automation saves money
The accounts receivable automation benefits fall into five categories: labor reduction, DSO compression, error and write-off reduction, processing fee optimization, and avoided hires as the business scales.
A quick word on how AR automation works at the mechanism level, since the savings are tied to specific process changes. Modern AR automation software handles invoice presentment through a customer portal, captures payment by card or ACH, applies cash automatically by matching incoming payments to open invoices using remittance data, runs dunning workflows triggered by aging buckets, and syncs everything back to the GL in real time.
Automated cash application is usually the single biggest labor win. Cash application software pulls remittance from email, lockbox files, and customer portals, then matches payments to invoices using a rules engine. Good cash application software also handles short pays and partial remittances by routing exceptions to a human review queue rather than holding up the month-end close. What used to take a clerk eight minutes per payment now takes under thirty seconds.
Typical DSO reduction
Companies deploying AR automation software see a significant drop in DSO within the first 12 months. Invoices go out faster. Customers can pay themselves without calling AR. Follow-up happens on schedule instead of when someone has time. Billing errors that used to trigger disputes get caught upstream.
Example: A 10-day DSO reduction on $50 million in revenue releases roughly $1.37 million in working capital. On the high end, deployments combining a native payment processor with collections automation have moved DSO from 45 days down to under 10. Don’t promise that range in your business case. Model the conservative one.
Staff time savings
Break the labor story into the three heaviest AR functions.
Cash application labor drops 70 to 85 percent. Automated cash application carries the bulk of those gains, since matching is the most repetitive and rules-friendly task on the AR clerk’s desk. Remittance matching, which is the messy work of reconciling bank deposits to customer remittance advice when payments cover multiple invoices or include deductions, drops 60 to 75 percent. Collections shifts from dialer-and-spreadsheet work to a prioritized worklist, so collectors spend their time on the 20 percent of accounts that need human judgment instead of the 80 percent that just need a reminder.
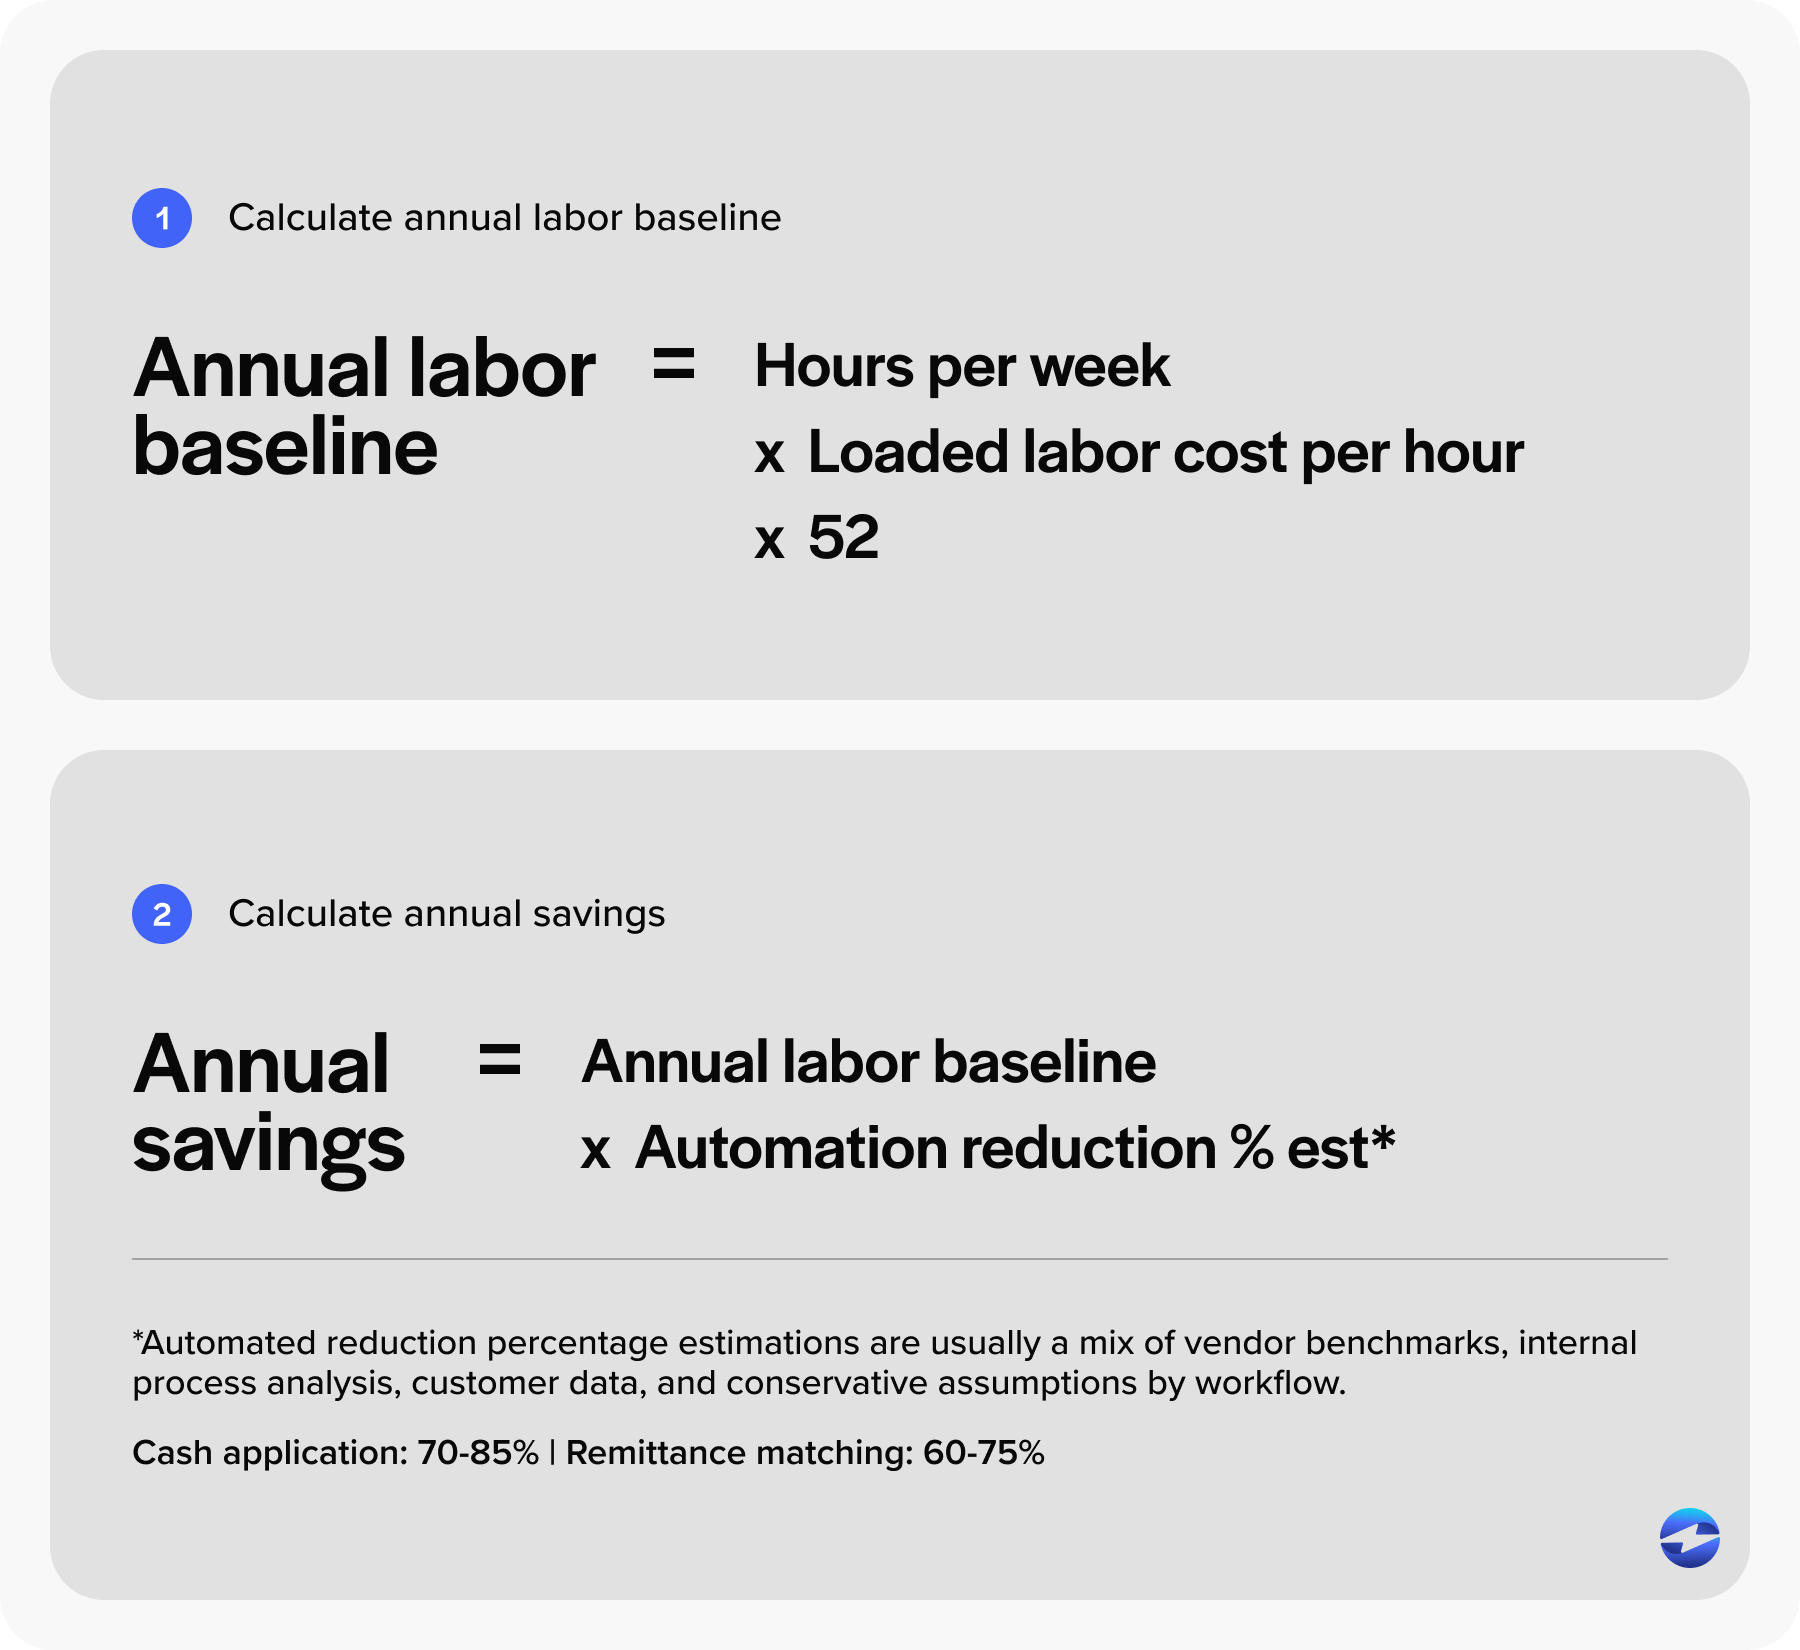
For the calculator, take hours per week per function, multiply by loaded labor cost, multiply by 52. That’s your annual labor baseline.
Simple ROI calculator
Five inputs, three outputs.
Inputs: monthly invoice volume, monthly payment volume in dollars, AR FTE count and loaded cost, current DSO, and annual revenue.
Calculation:
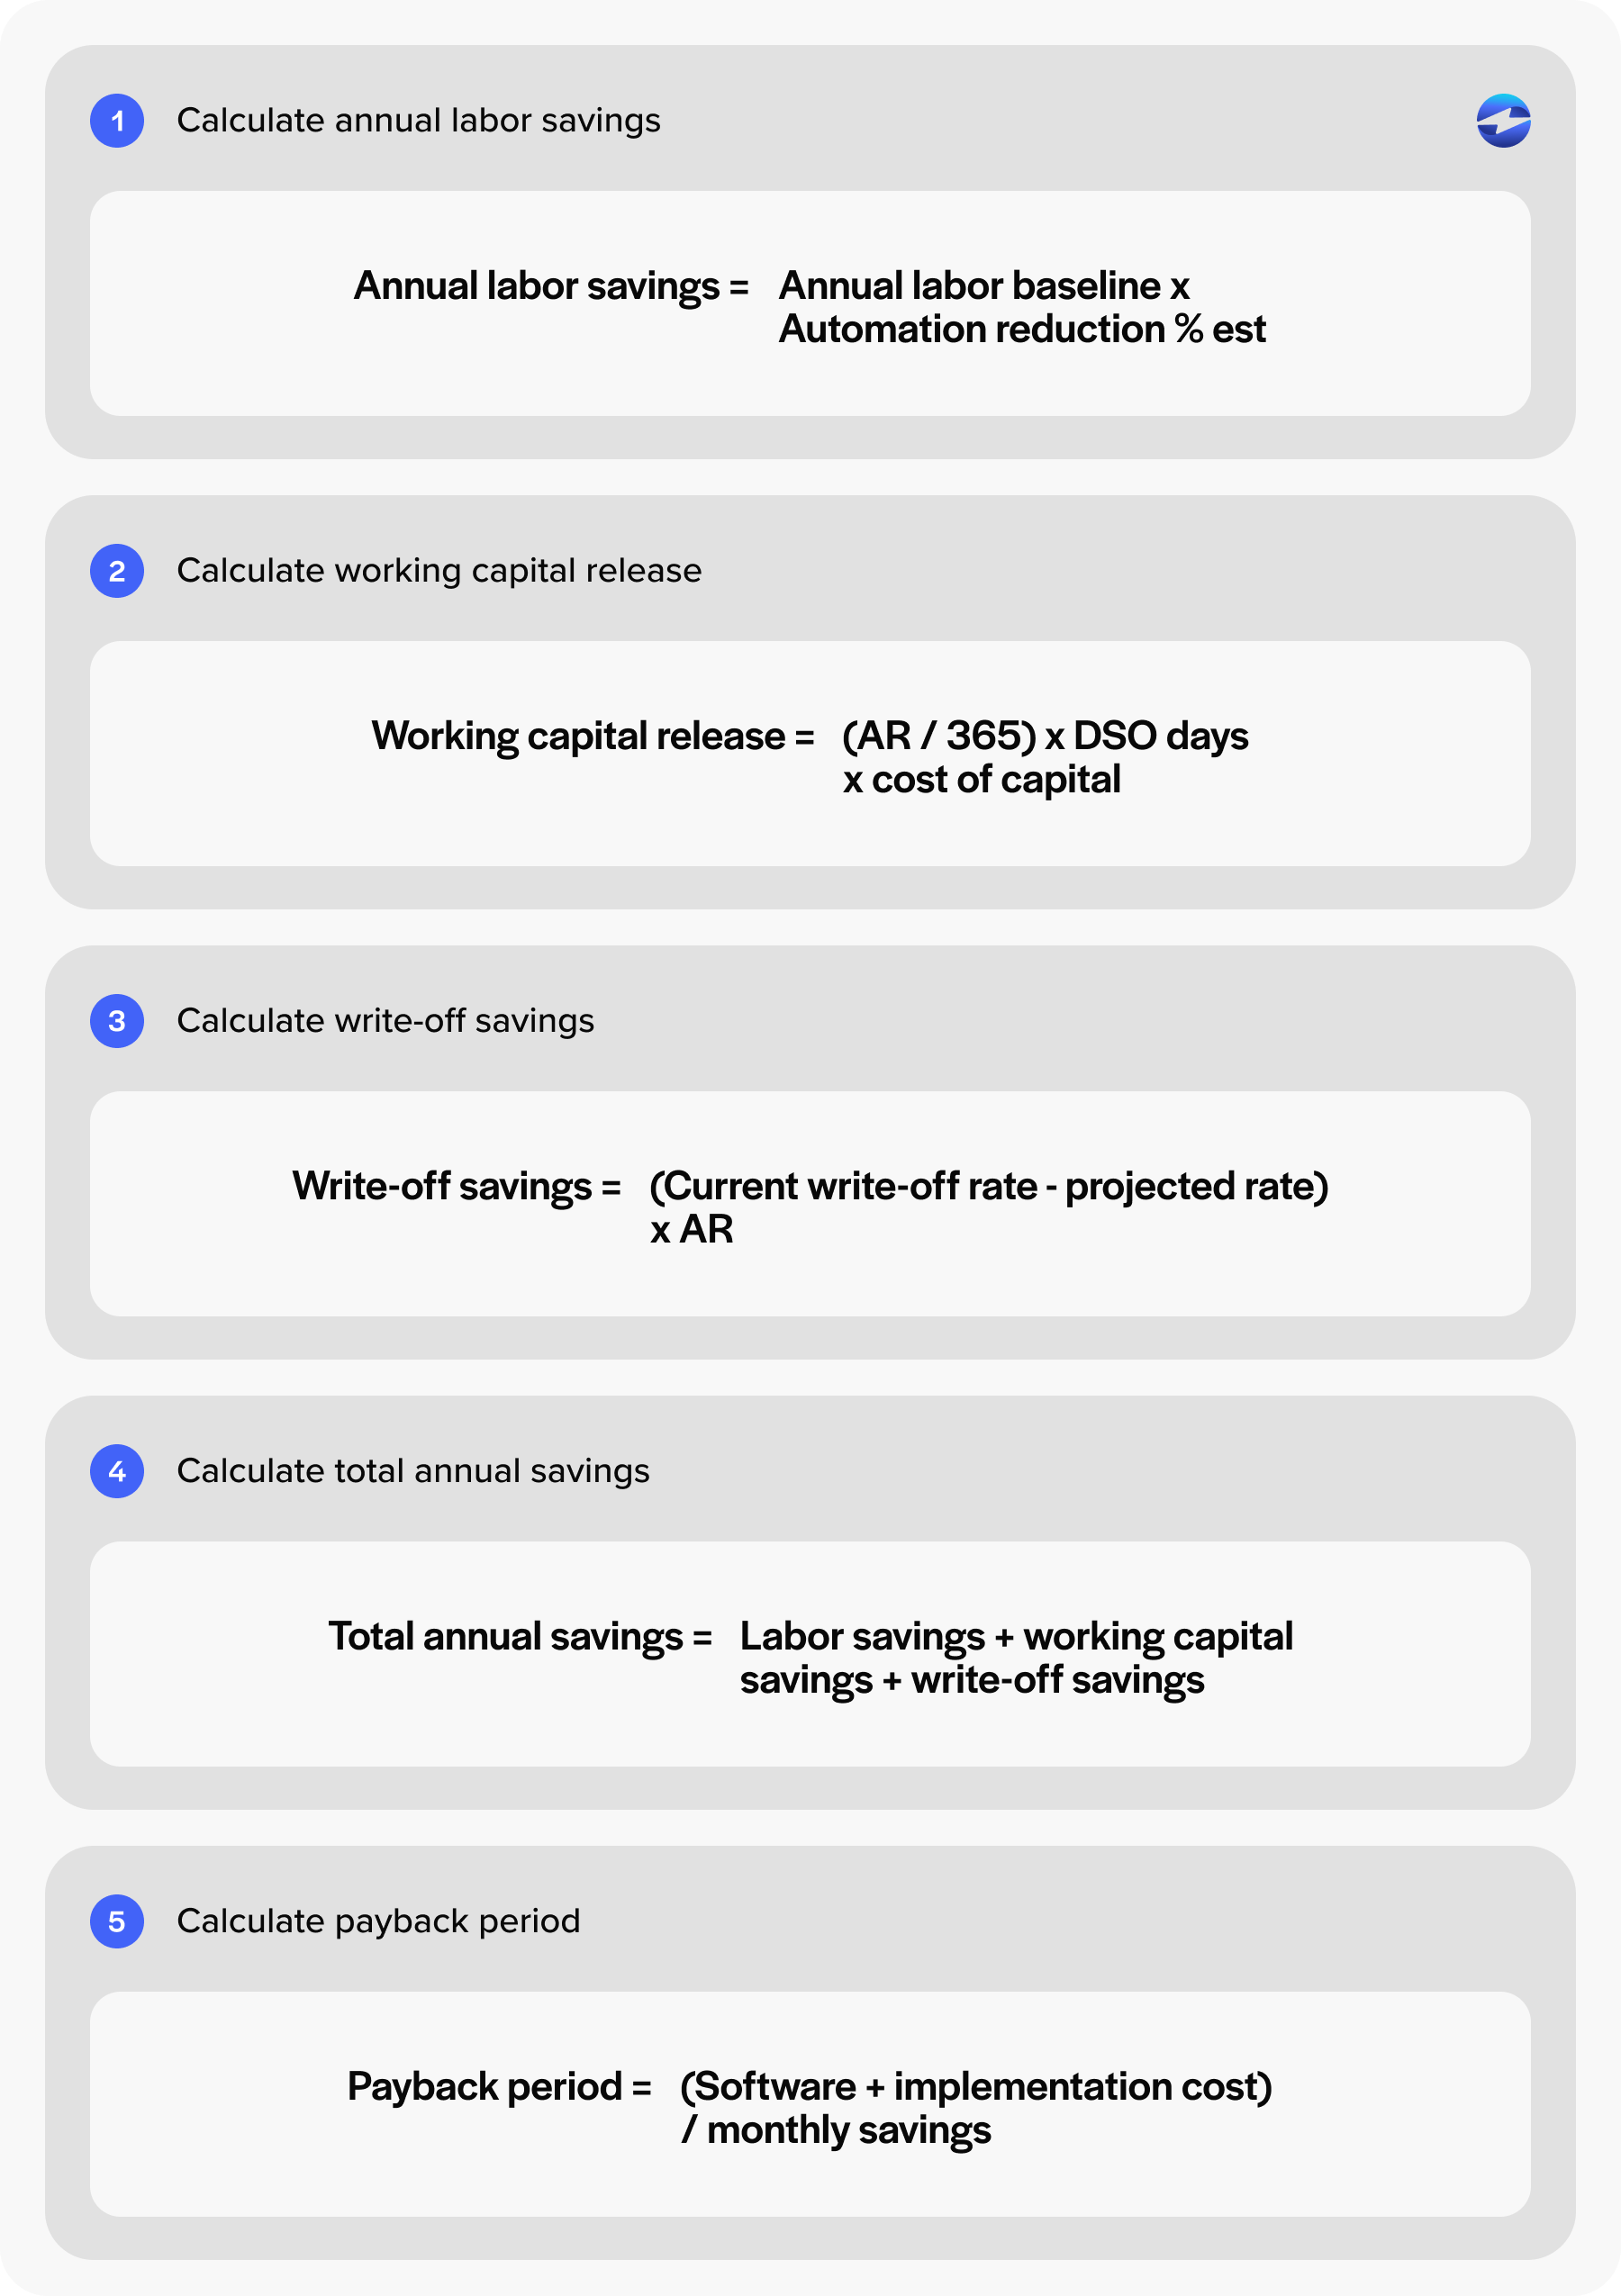
- Labor savings = current AR hours times percent automatable times loaded hourly cost
- Working capital release = (annual revenue divided by 365) times projected DSO reduction times cost of capital
- Write-off savings = (current write-off rate minus projected rate) times annual revenue
- Total annual savings = sum of the three
- Payback period = (software cost plus implementation cost) divided by monthly savings
Example accounts receivable automation savings/roi calculation:
A $25 million B2B company with two AR employees earning $75,000 each annually could estimate labor savings by assuming AR automation reduces 60% of manual work. That produces approximately $90,000 in labor savings.
If the company reduces DSO by 8 days, the calculator estimates approximately $55,000 in working capital improvements using a 10% cost of capital assumption.
For write-off savings, the company may estimate reducing annual bad debt expense from 0.5% of revenue ($125,000) to 0.25% of revenue ($62,500) after automation, creating another estimated $62,500 in savings.
Combined, these improvements would generate an estimated $207,000 in annual AR automation savings.
That’s the AR automation ROI picture finance committees will actually engage with.
Pricing versus standalone AR tools
Three pricing models exist in this market.
Standalone AR automation software typically costs $25,000 to $150,000 or more in annual platform fees, separate from payment processing costs. Bolt-on payment processor add-ons charge less but offer thinner automation depth. Native embedded platforms fold the AR automation layer into the payment processing solution itself.
The EBizCharge payment solution sits in the third category. The pricing logic is different because the payment processing solution funds the automation layer rather than charging a separate platform fee. A few cost lines worth noting:
- 100-plus native ERP, CRM, and eCommerce integrations remove the integration build, which usually saves $15,000 to $75,000 versus standalone tools
- 24/7 U.S.-based support is included, not a separate SKU
- Level 3 processing and surcharging are built in, which directly reduces interchange fees and can fund the platform on its own
- 20-plus years of operating tenure means pricing stays stable, without the venture-backed hikes common in standalone AR vendors
Break-even timeline
Three variables determine payback.
AR labor baseline matters most. Companies with two or more FTEs on AR break even fastest. DSO starting point matters second. A higher starting DSO means a bigger working capital release. Payment mix matters third. Card-heavy companies break even faster because Level 3 fee savings stack on top of the labor and DSO wins.
Typical ranges by model:
- Native integrated payment processor and AR layer: 4 to 9 months
- Standalone AR automation software: 12 to 24 months once integration costs are loaded in
- Processor with bolt-on AR features: 9 to 18 months
Implementation cost comparison
This is the line item that kills standalone deployments in year one. Implementation includes integration engineering, data migration of open AR and customer master records, internal IT time, training, and a parallel running period.
Standalone AR automation software typically charges $25,000 to $100,000 in implementation fees and takes 4 to 9 months to deploy. Native embedded platforms ship with the integration pre-built, so deployments measured in weeks are normal, and implementation fees are often nominal.
The shorthand: native beats bolt-on on three lines of the P&L. Software cost, implementation cost, and time to value.
Pulling it together
Automating accounts receivable is one of the few finance investments where the ROI is well-documented, and the math holds up under scrutiny. The accounts receivable automation benefits also compound over time, since each year of lower DSO and lower headcount cost flows straight to the bottom line.
The harder question isn’t whether accounts receivable automation pays back. It’s which deployment model pays back fastest given your ERP, your AR baseline, and your payment mix.
Run the calculator against your own numbers. Model the conservative case, not the marketing case. Then evaluate vendors on total cost of ownership rather than platform fee alone. For most mid-market B2B operations, automating accounts receivable through a native payment processor produces a faster payback and a smaller integration footprint than standalone AR tools. That’s the case worth bringing to the finance committee.
- What manual AR actually costs
- Where automation saves money
- Typical DSO reduction
- Staff time savings
- Simple ROI calculator
- Example accounts receivable automation savings/roi calculation:
- AR Automation Savings Calculator
- Pricing versus standalone AR tools
- Break-even timeline
- Implementation cost comparison
- Pulling it together

