Blog > Understanding Profit and Loss (P&L) Statements: A Complete Guide
Understanding Profit and Loss (P&L) Statements: A Complete Guide
Navigating the complexities of finances can feel like deciphering a foreign language, especially without the right tools and statement documents.
A cornerstone of financial literacy within a business is mastering the profit and loss (P&L) statement, a crucial document that summarizes revenues, costs, and expenses over a specific period. Businesses of all sizes rely on P&L statements to track financial health, making it essential for entrepreneurs and managers to comprehend their intricacies.
This comprehensive guide will explain P&L statements, including their vital components, different types, and setup processes.
What is a profit and loss (P&L) statement?
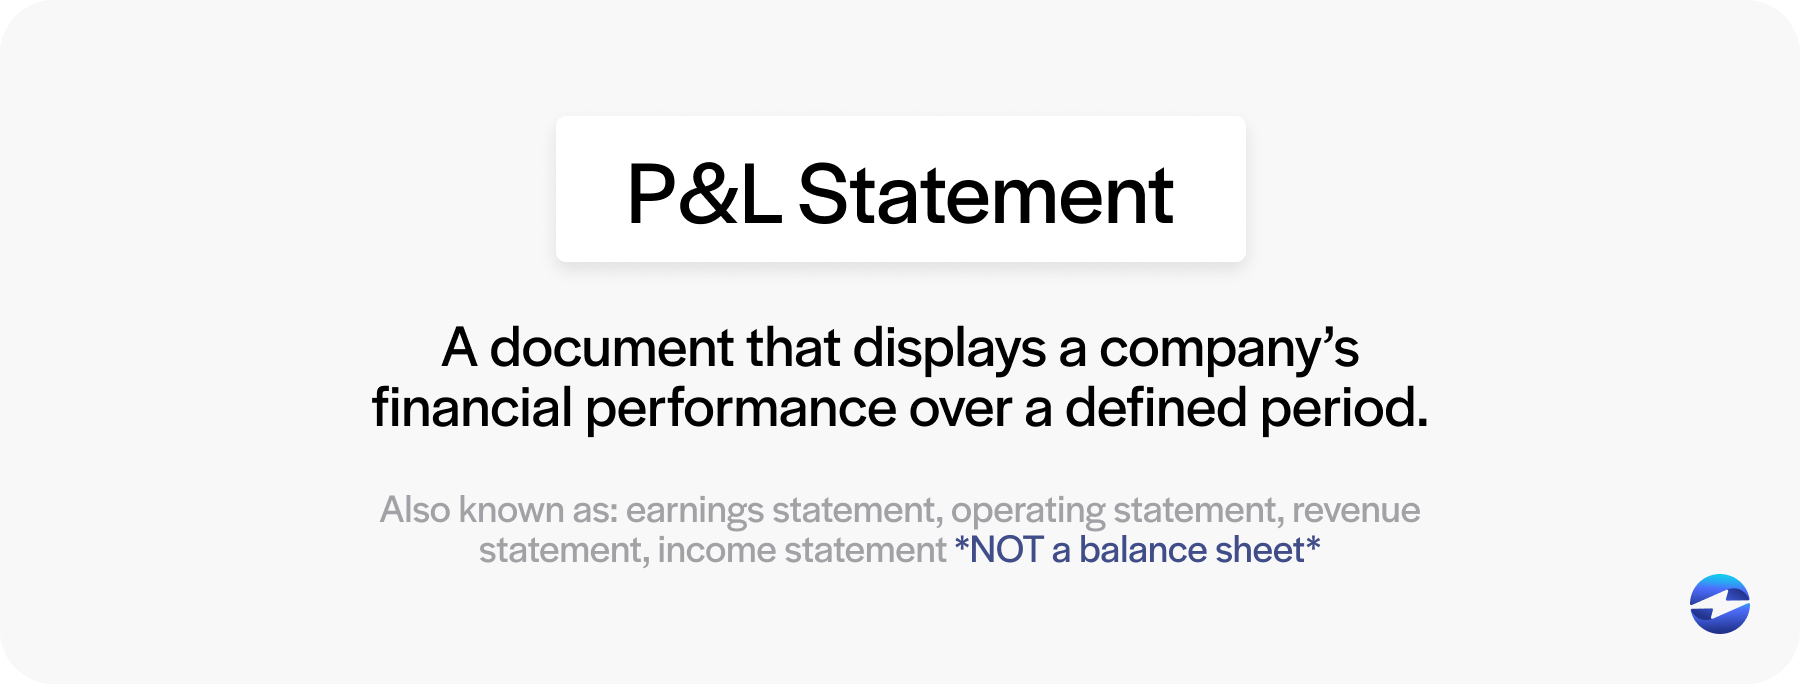
A P&L statement is a crucial document that displays a company’s financial performance, such as its revenue, costs, and expenses, over a defined period.
In addition to detailing how much money came in and what went out as expenses, P&L statements provide a snapshot of a company’s ability to generate profit by increasing revenue, reducing costs, or both.
P&L statements can go by many names, including earnings statements, operating statements, revenue statements, or, more commonly, income statements.
By reviewing a P&L report, businesses can assess operating income and evaluate crucial profit margins.
Businesses should be careful not to confuse P&L reports with balance sheets, as the two serve different purposes.
Profit and loss statements vs. Balance sheets
While P&L statements and balance sheets can be mixed up, the two financial documents differ.
A P&L report provides insight into a company’s profitability over a particular period, whereas a balance sheet presents a snapshot of a company’s financial standing at a single point in time.
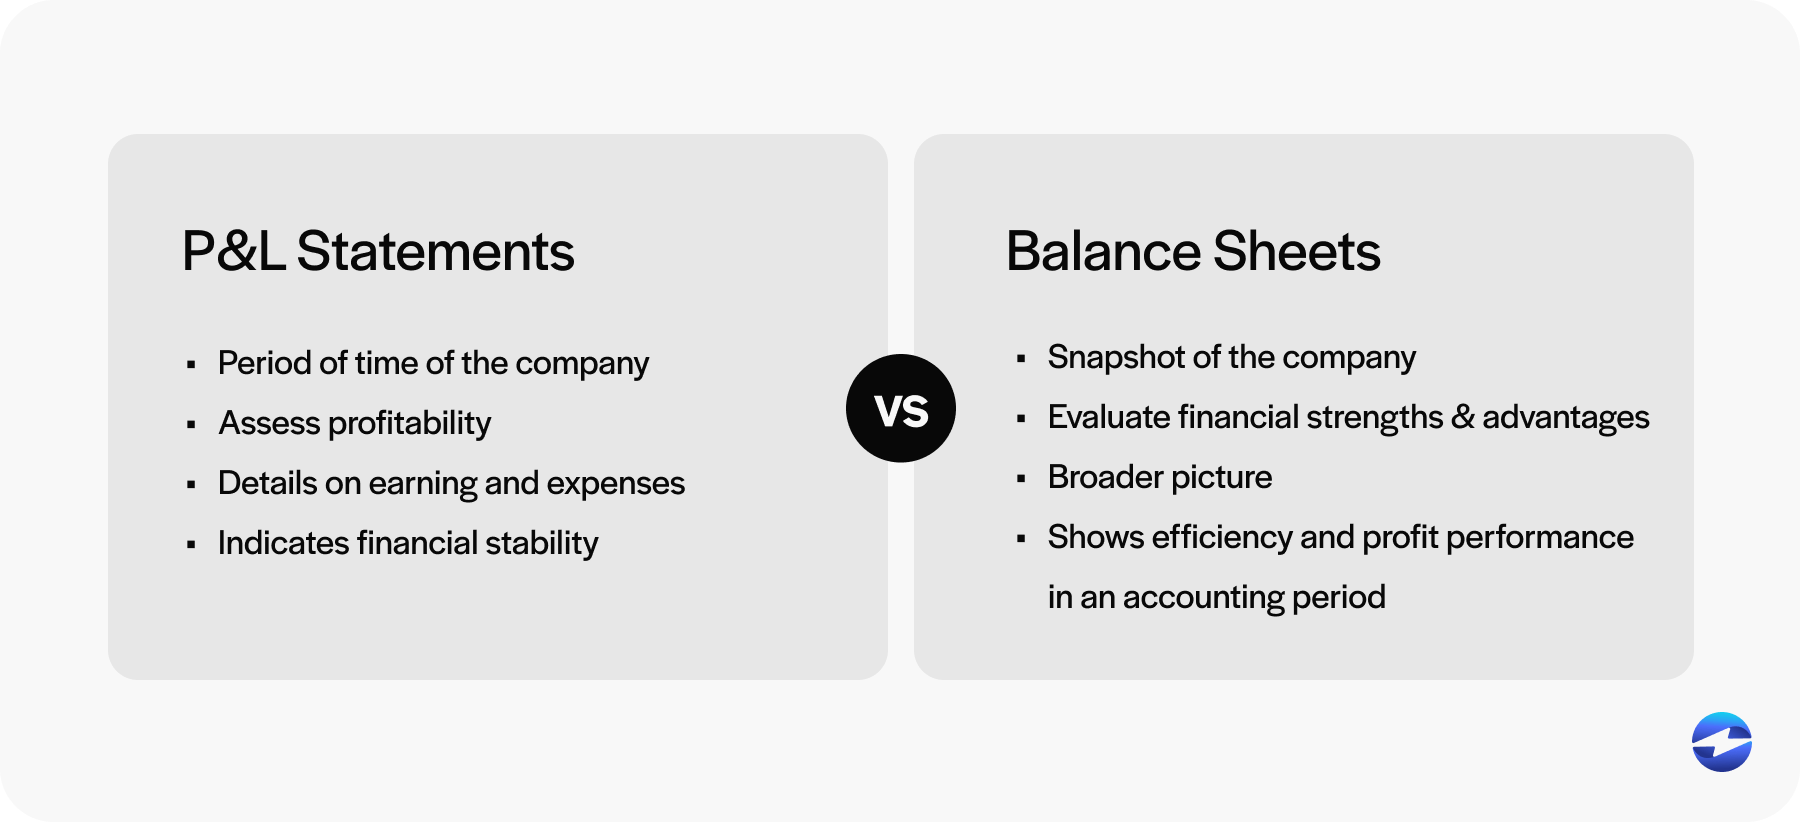
A P&L statement focuses on operational performance by detailing earnings and expenses. In contrast, a balance sheet focuses more on financial position by offering a broader picture of what a company owns and owes rather than the flow of expenses and income. The balance sheet can indicate financial stability, while the P&L statement can show efficiency and profit performance during a specific accounting period.
Both documents are vital for comprehensive financial analysis and provide valuable insights into a company’s financial health.
Businesses and stakeholders use these reports to make informed financial decisions — P&L statements can help assess profitability, while balance sheets can help evaluate financial strength and advantages.
Now that you know what a profit and loss statement is, you should understand its individual components.
9 components of a profit and loss statement
Each component of the P&L statement provides valuable insights into how a business generates revenue, manages costs, and ultimately arrives at its bottom line.
From revenue and cost of goods sold to operating income and net profit, these elements work together to paint a comprehensive picture of probability.
Here are nine components of the P&L to know:
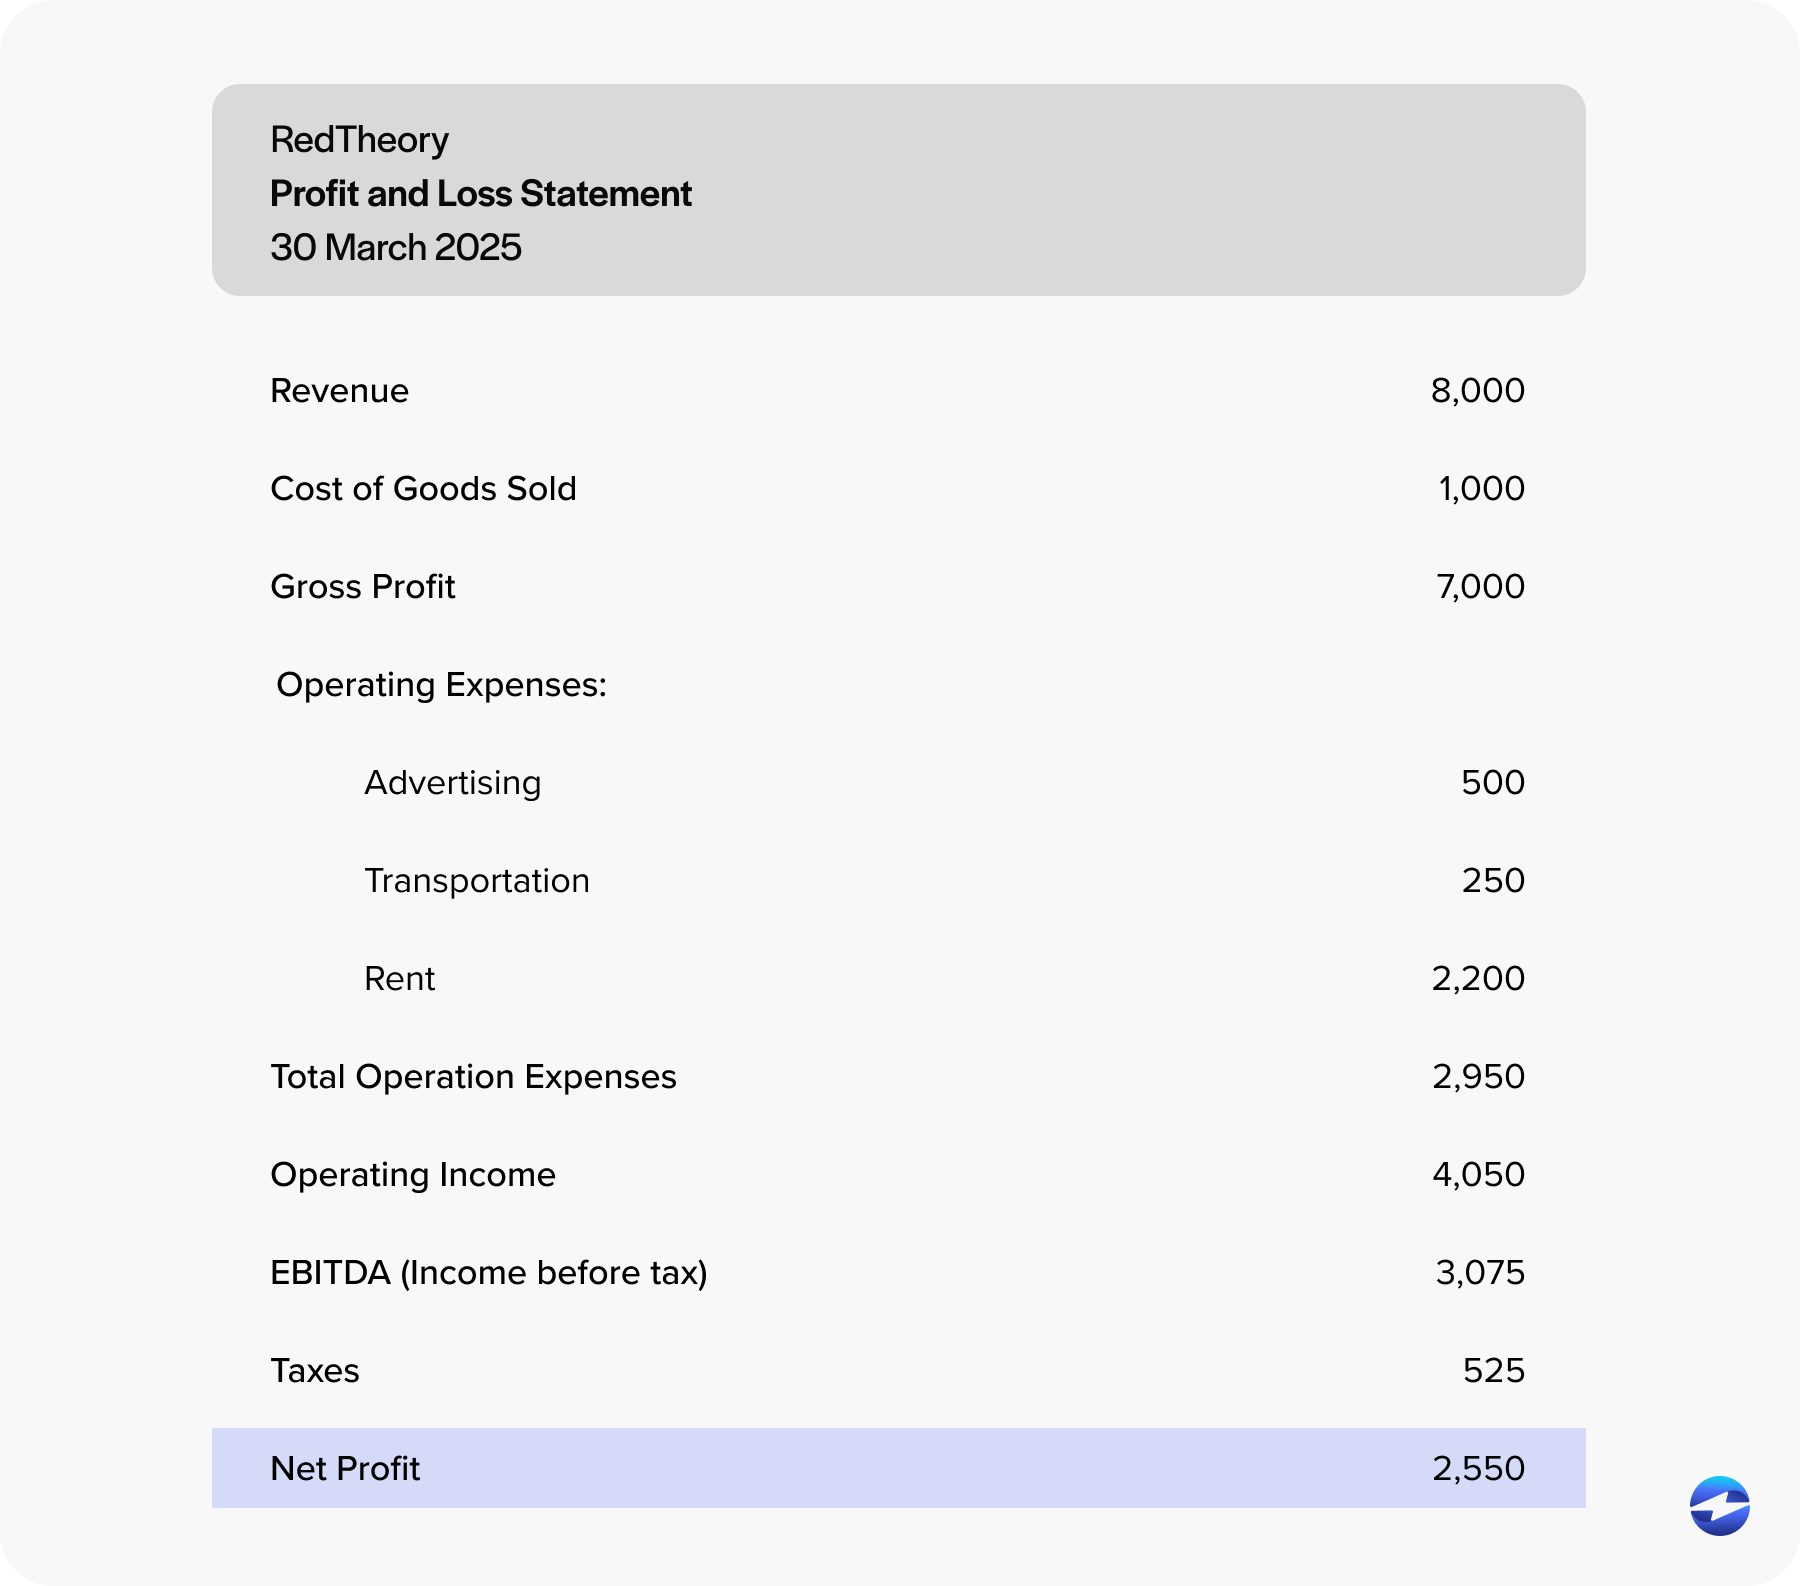
- Revenue: Revenue is the total income generated from the sale of goods or services before any expenses are deducted. It represents the top line of the P&L statement and serves as the starting point for evaluating financial performance.
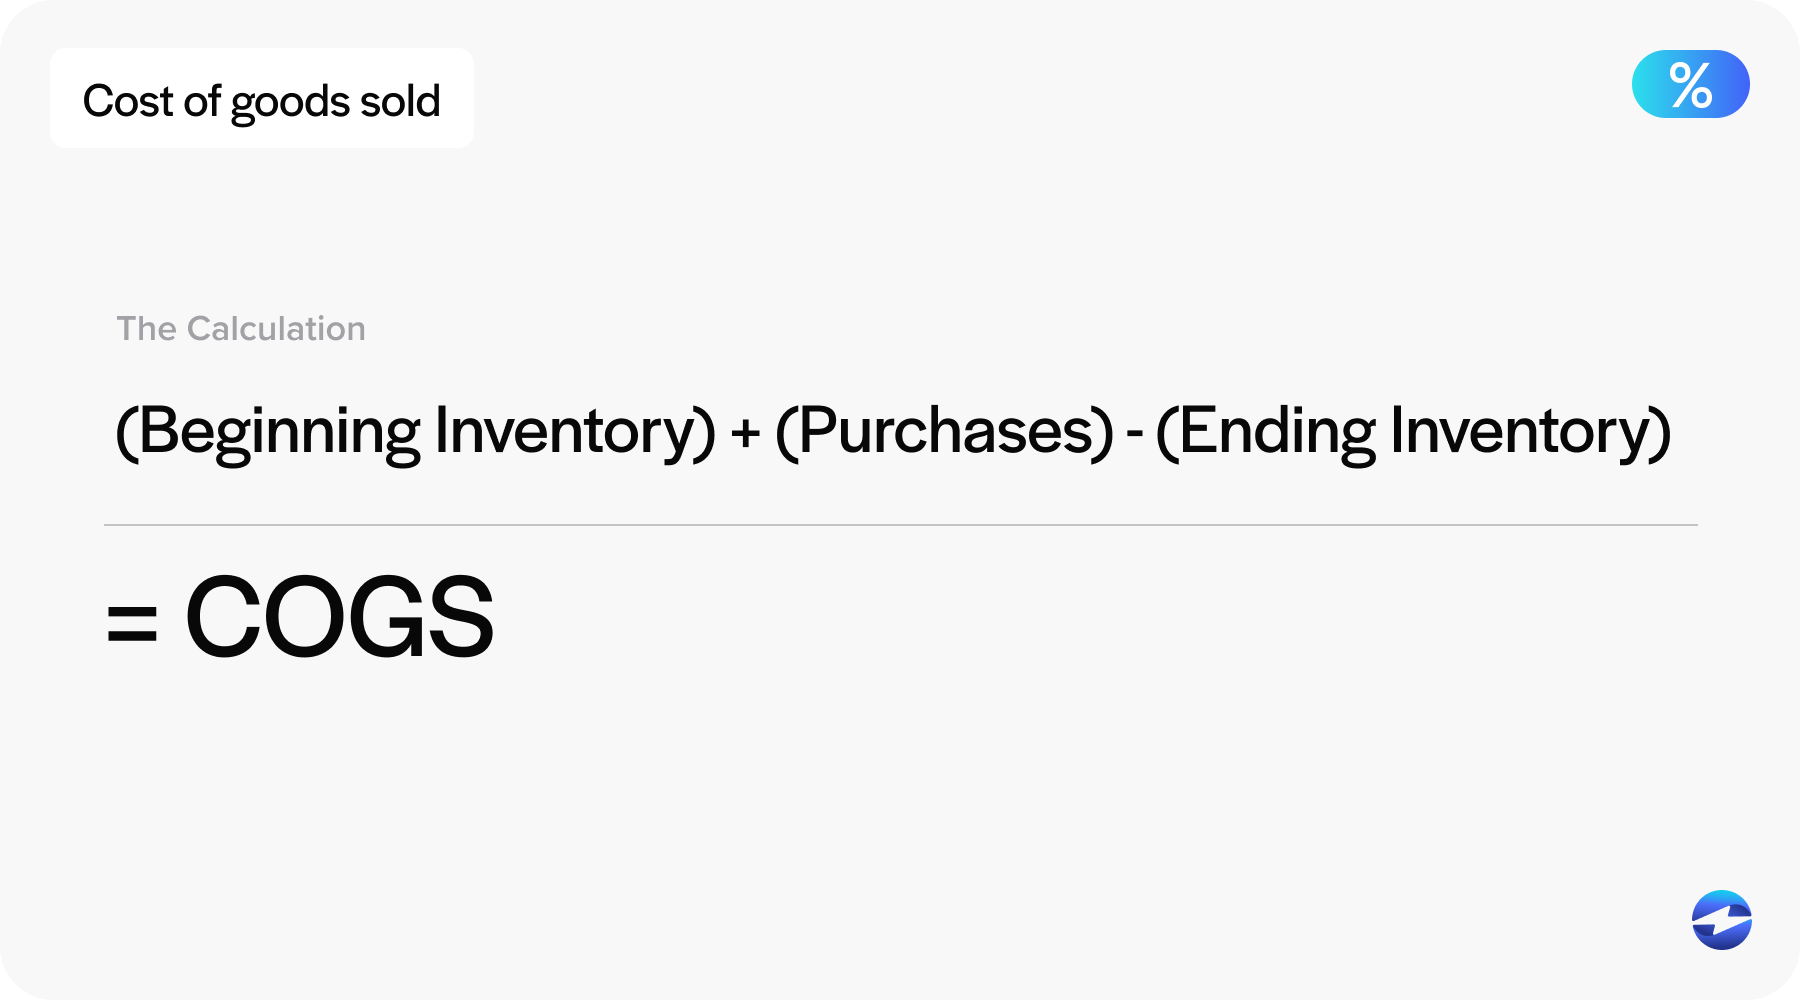
- Cost of goods sold (COGS): COGS refers to the direct costs of producing the goods or services a company sells. This includes expenses such as raw materials, labor, and manufacturing overhead. Subtracting COGS from revenue gives the gross profit, which shows how efficiently a company produces and sells its offerings.
- Gross profit: Gross profit is the amount a company earns from its revenue after subtracting COGS. It reflects how efficiently a business produces and sells its products. On a P&L statement, gross profit serves as the starting point for calculating operating profit and net income.
- Operating expenses: Operating expenses include all costs incurred in everyday business operations, such as salaries, rent, utilities, marketing, and administrative expenses. These are necessary to run the business but aren’t directly tied to the production of goods or services.
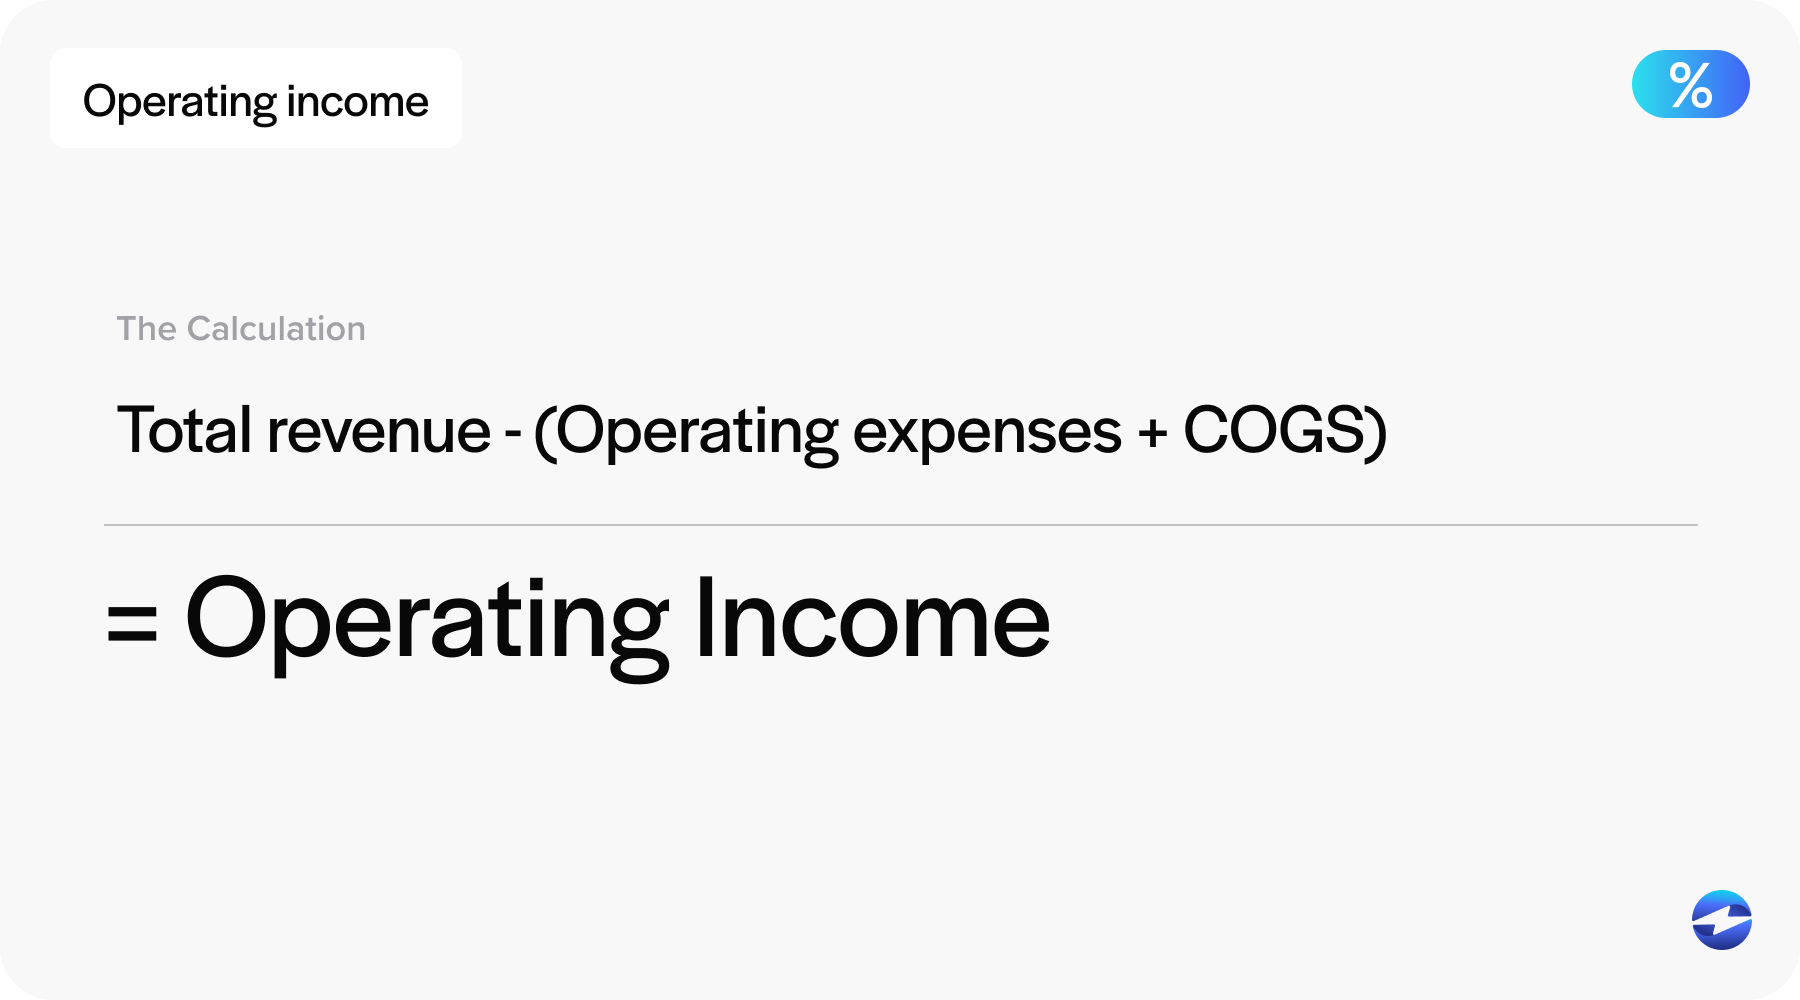
- Operating income: Operating income, also known as operating profit, is the result of subtracting operating expenses from gross profit. It reflects the company’s profit from core operations, excluding any non-operating income or expenses.
- Other income and expenses: Other income and expenses consist of non-core business activities, such as interest income, investment gains or losses, and one-time charges. These figures are added to or subtracted from operating income to calculate earnings before taxes (EBT).
- Earnings before taxes (EBT): EBT is the profit a company earns before tax obligations are taken into account. It provides a view of profitability from all sources, both operational and non-operational.
- Taxes: Taxes are calculated based on the applicable tax rates and are deducted from EBT to determine the company’s final profitability.
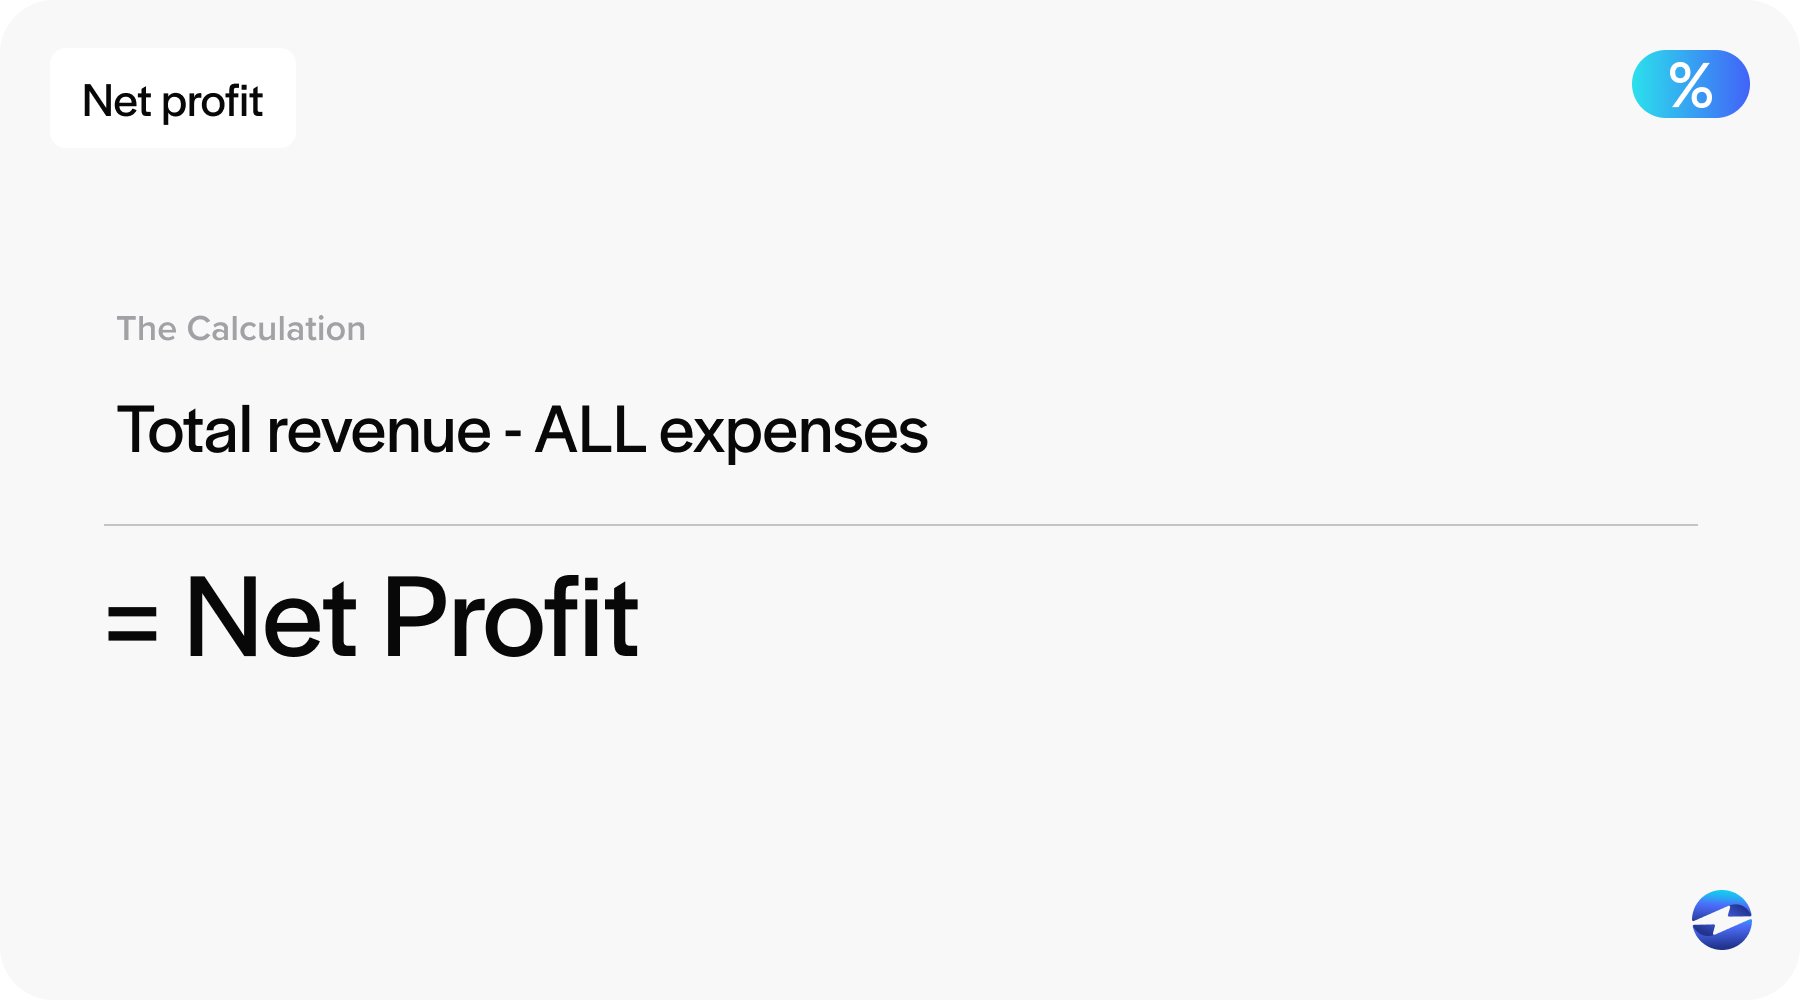
- Net profit: Net profit, also known as net income or the bottom line, is the amount remaining after all expenses, including taxes, have been deducted from total revenue. It represents the business’s true profit and is a key indicator of overall financial success.
By understanding these components, businesses can effectively interpret their P&L statements, monitor financial performance, and make strategic decisions to support long-term growth.
In addition to its vital components, businesses should understand the types of P&L statements.
Types of profit and loss statements
Knowing the types of profit and loss (P&L) statements is vital for gaining unique insights into a company’s financial health and performance over time.
Two types of P&L statements include the single-step and multi-step methods.
Single-step method
The single-step profit and loss statement method simplifies financial reporting by presenting all revenues (operating and non-operating) in a single section.
The same approach is used for listing all expenses, including direct expenses and overhead costs. Calculating the net income becomes straightforward by subtracting total expenses from total revenues.
Small businesses and those who value simplicity may favor the single-step method, as it clearly shows the bottom line without breaking down detailed information. It offers a straightforward snapshot of financial performance but may lack the depth needed for more complex business analysis.

Multi-step method
The multi-step method offers a detailed view of a company’s financial activities by dividing the P&L statement into sections, such as operating revenues, cost of sales, and non-operating expenses.
The multi-step method starts by calculating gross profit, subtracting direct costs from total revenue. It then determines operating income by deducting operating expenses from the gross profit.
Analysts and investors tend to prefer this method for public companies, as it offers a clearer picture of how each area impacts overall profitability and can aid in strategic planning and improving margins.
Knowing the differences between these two methods can aid in interpreting the data more accurately. Now that you’re familiar with the different types of profit and loss statements, you can learn how to draft this statement.
How to create a profit and loss statement
Whether you’re a small business owner or part of a larger finance team, understanding how to build an accurate P&L statement allows you to track performance, identify growth opportunities, and make informed financial decisions.
The following sections will provide 10 steps to properly create a P&L statement.

1. Choose a reporting period
The first step in creating a profit and loss statement is choosing a reporting period. This means deciding the time frame that the statement will cover.
Most businesses prepare these statements monthly, quarterly, or annually. The choice depends on the needs of the business and the level of financial insight required. For instance, a monthly report provides more frequent updates.
A clear reporting period helps in tracking ongoing expenses and sudden financial changes. Choosing the correct period ensures you have consistent data to compare over time.
2. List all revenue
Listing all revenue involves detailing all sources of income your business brings in, such as sales, rental income, and any other revenue associated with your core operations.
Each source of revenue provides insight into how your business generates income. Precise categorization of income helps reveal which areas are strongest or need improvement. This clarity aids in strategic planning and focusing on revenue-enhancing activities.
3. Calculate COGS
Another step in creating a P&L statement is calculating COGS, the direct costs of producing goods sold by a business, such as raw materials and labor.
Calculating COGS is crucial since it affects gross profit margins and can identify areas of waste and improve efficiency. A clear understanding of these costs helps with pricing decisions and profit analysis.
4. Add operating expenses
Adding operating expenses in a P&L statement includes all ongoing business expenses except production costs, such as marketing costs, salaries, and office rent. These costs are typically essential in keeping a company running smoothly.
Recording these expenses helps identify areas where cost-cutting may be possible. It also highlights how effectively the business uses its resources to generate income.
5. Calculate operating income and EBITDA
Operating income is the profit generated from standard business operations after subtracting operating expenses and COGS from total revenue. This figure shows how much money the business makes from its core activities.
A good operating income indicates efficient business operations. This step is critical as it provides a clear picture of the operational profitability before considering taxes and other non-operational costs.
After determining operating income, you may also want to calculate earnings before interest, taxes, depreciation, and amortization (EBITDA) to understand your company’s operational performance better. EBITDA focuses on earnings before the impact of interest payments, tax obligations, and non-cash expenses like depreciation and amortization.
To calculate EBITDA, start with operating income, then add depreciation and amortization expenses. This metric is especially useful for comparing profitability between companies or evaluating a business’s ability to generate cash flow from operations.
6. Add other income or expenses
Next, include any additional income or expenses in the statement to account for any extra income outside of core business activities, such as interest from investments, profits from asset sales, and other costs like losses from lawsuits or write-offs.
These figures provide a comprehensive financial picture and ensure that all elements affecting profit are considered and evaluated for their overall impact.
7. Subtract taxes
Since taxes are mandatory contributions required by law, calculating them accurately is essential and will help you avoid legal complications.
Calculating taxes means applying the correct tax rate to your pre-tax income. Once taxes are subtracted, your business gets a clearer picture of its financial position. This step helps reveal the true net profit or loss after tax responsibilities.
8. Determine net profit (or loss)
Determining net profit or loss is the final calculation step and involves subtracting all expenses, including COGS, operating expenses, other expenses, and taxes, from total revenue. The result is either a net profit or a net loss.
Net profit means the business earned more than it spent, while a net loss indicates higher expenses than income.
Understanding this helps evaluate the overall success of the company. It’s the bottom-line figure that provides a snapshot of financial health.
9. Review and format the statement
After calculations, it’s important to review and format the P&L statement by carefully checking numbers for accuracy and ensuring clarity in the presentation.
To help with this formatting, businesses should arrange all information in a logical sequence for easy understanding. Use consistent headings and line items, label each section clearly, and align figures properly for better readability. Including totals and subtotals where appropriate can also make the statement easier to interpret.
A well-formatted statement enhances communication with stakeholders. A clear presentation simplifies spotting financial trends and improvement areas. An organized statement accurately reflects financial data and is a tool for strategic decision-making.
10. Use tools or software
Many accounting software options simplify this process by providing templates and automated calculations. These tools reduce the chances of errors and save time. They also offer features like summaries and visual reports.

Software solutions enhance efficiency and provide instant access to financial data. Leveraging technology ensures precision and streamlines financial reporting, keeping your business aligned with its monetary goals.
Following each step carefully ensures that your financial data is accurate, complete, and easy to interpret.
Streamlining profit and loss statements with EBizCharge
EBizCharge is a leading payment processing solution that enables merchants to accept and manage payments directly within their existing accounting and enterprise resource planning (ERP) systems.
By allowing businesses to collect payments without leaving their software environment, EBizCharge improves workflow efficiency and automatically records payment data in the correct financial accounts.
This built-in functionality simplifies the creation and interpretation of P&L statements by automating the flow of payment information into accounting systems. As a result, businesses can generate P&L reports faster, reduce the risk of manual entry errors, and maintain more accurate financial records.
These improvements give companies clearer visibility into their revenue, expenses, and profit margins — key elements for precise analysis and strategic planning.

