Blog > Exploring Solvency Ratios: Definition, Types, and Importance
Exploring Solvency Ratios: Definition, Types, and Importance

When evaluating overall fiscal health, solvency ratios are essential financial metrics that offer valuable insights into a company’s ability to meet its long-term debts and obligations.
Understanding these ratios is vital for investors, creditors, and management to gauge a company’s sustainability and growth potential. Calculating and analyzing these ratios enables stakeholders to understand how equipped a business is to withstand economic downturns and capitalize on growth opportunities.
What is a solvency ratio?
Solvency ratios provide insights into whether a company has sufficient cash flow to continue operating and to service its debt over time. These ratios are essential components of financial statements and are keenly observed by investors, creditors, and financial analysts.
The concept of solvency pertains to an entity’s capacity to continue its operations indefinitely, pay off long-term debts and interest on borrowings, and review its overall financial stability.
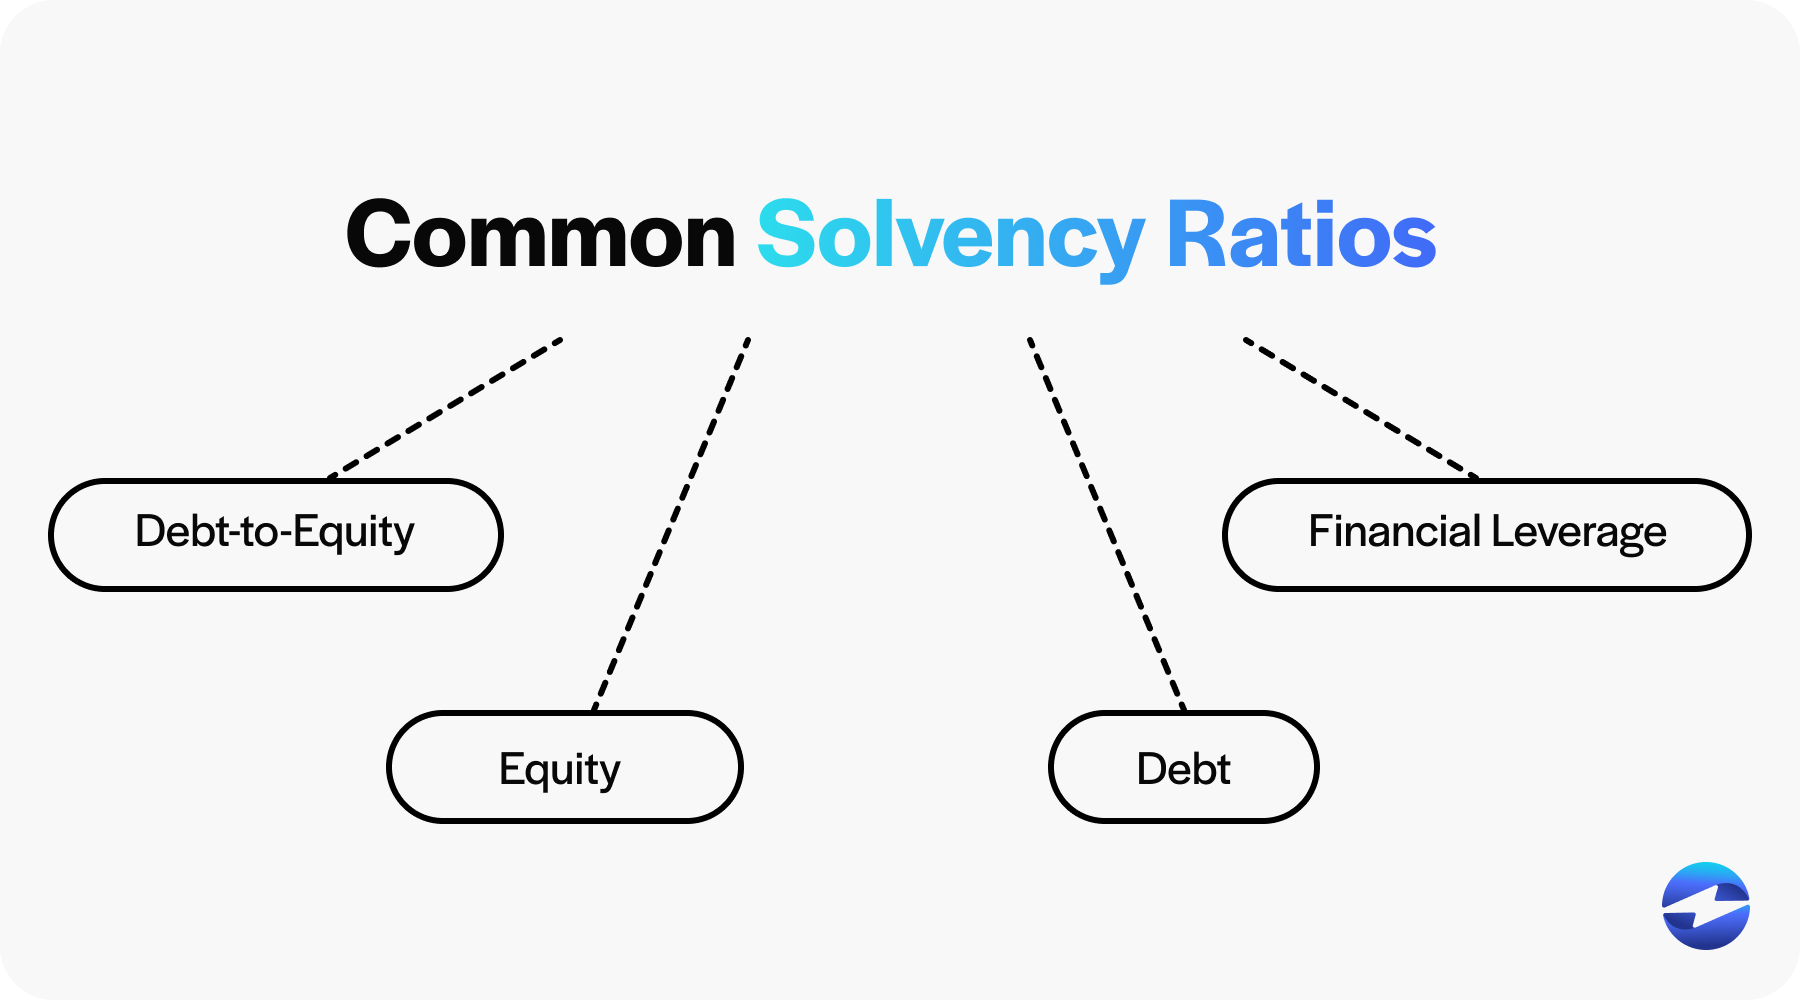
Common solvency ratios include the debt-to-equity ratio, equity ratio, debt ratio, and financial leverage ratio.
Solvency ratios offer a snapshot of a company’s financial position and capacity to sustain operations in the face of financial risk by comparing its debt levels to its assets, equity, or earnings.
The importance of solvency ratios
Solvency ratios are vital for stakeholders such as investors and prospective business lenders to understand the financial standing and risk associated with a particular company.
Businesses with healthy solvency ratios signify a sustainable capital structure, enhancing their ability to attract investment and secure favorable lending terms.
Timely analyses of solvency ratios can prevent financial distress, guide strategic decisions to optimize the balance sheets, and ensure longevity in competitive marketplaces.
In addition to solvency ratios, liquidity ratios are another financial metric often considered when looking at a company’s financial health.
What is the difference between solvency ratios and liquidity ratios?
While solvency ratios and liquidity ratios offer significant financial metrics that gauge a company’s financial health, each focuses on different aspects.
Solvency ratios measure a company’s ability to meet its long-term debts and obligations, indicating whether its capital structure and financial leverage are sustainable over time.
In contrast, liquidity ratios concentrate on a company’s ability to cover its short-term obligations without raising external capital. They determine whether a company has enough liquid assets to pay off its current liabilities. Key liquidity ratios include the current and quick ratios, which compare current and liquid assets against short-term debt.
Here’s a breakdown of the main differences between solvency ratios and liquidity ratios:
| Financial Metric | Focus | Related to | Example Ratios |
|---|---|---|---|
| Solvency Ratios | Long-term financial health | Long-term debt, financial leverage | Debt to Equity Ratio, Equity Ratio |
| Liquidity Ratios | Short-term financial health | Short-term obligations, liquid assets | Current Ratio, Quick Ratio |
In addition to the differences between these two ratios, solvency ratios can be categorized into four ratio types with different significance.
4 types of solvency ratios and their formulas
Within financial analysis, various solvency ratios assess a company’s ability to meet its debt obligations. Each ratio utilizes different financial statement components to offer insights into its solvency.
Four common solvency ratios include the interest coverage ratio, debt-to-asset ratio, equity ratio, and debt-to-equity ratio.
Interest coverage ratio (ICR)
The Interest Coverage Ratio (ICR) is a financial ratio that gauges a company’s capacity to manage its debt by comparing earnings to interest expenses.
The ICR indicates how comfortably a company can pay interest on outstanding debt without resorting to its capital. Creditors and investors closely scrutinize this coverage ratio as it reflects the company’s financial leverage and risk level.
Businesses can use the Interest Coverage Ratio (ICR) formula to calculate this data:
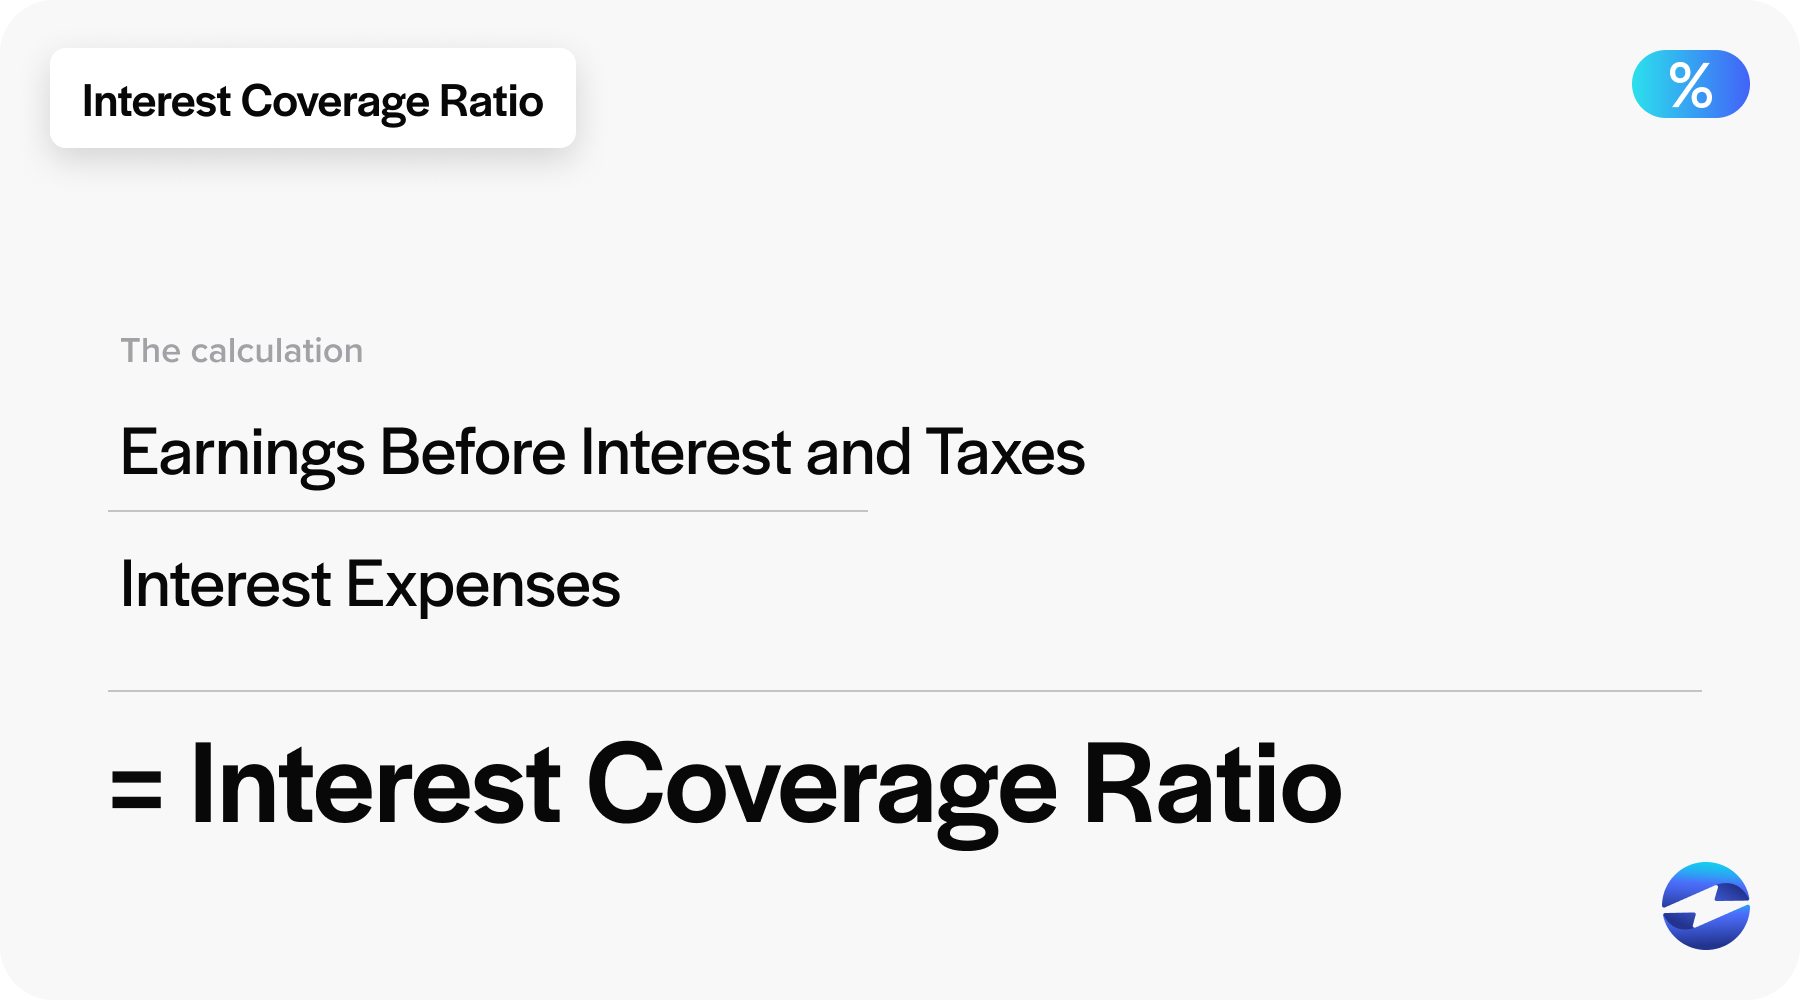
Interest Coverage Ratio = Earnings Before Interest and Taxes (EBIT) / Interest Expenses
In the formula, earnings before interest and taxes (EBIT) are a company’s profit before deducting interest and taxes, and interest expense refers to the ongoing cost of a company servicing its debt.
Interest Coverage Ratio Example
Assume a business reports earnings before interest and taxes of $120,000 and interest expenses of $30,000. Using the ICR formula:
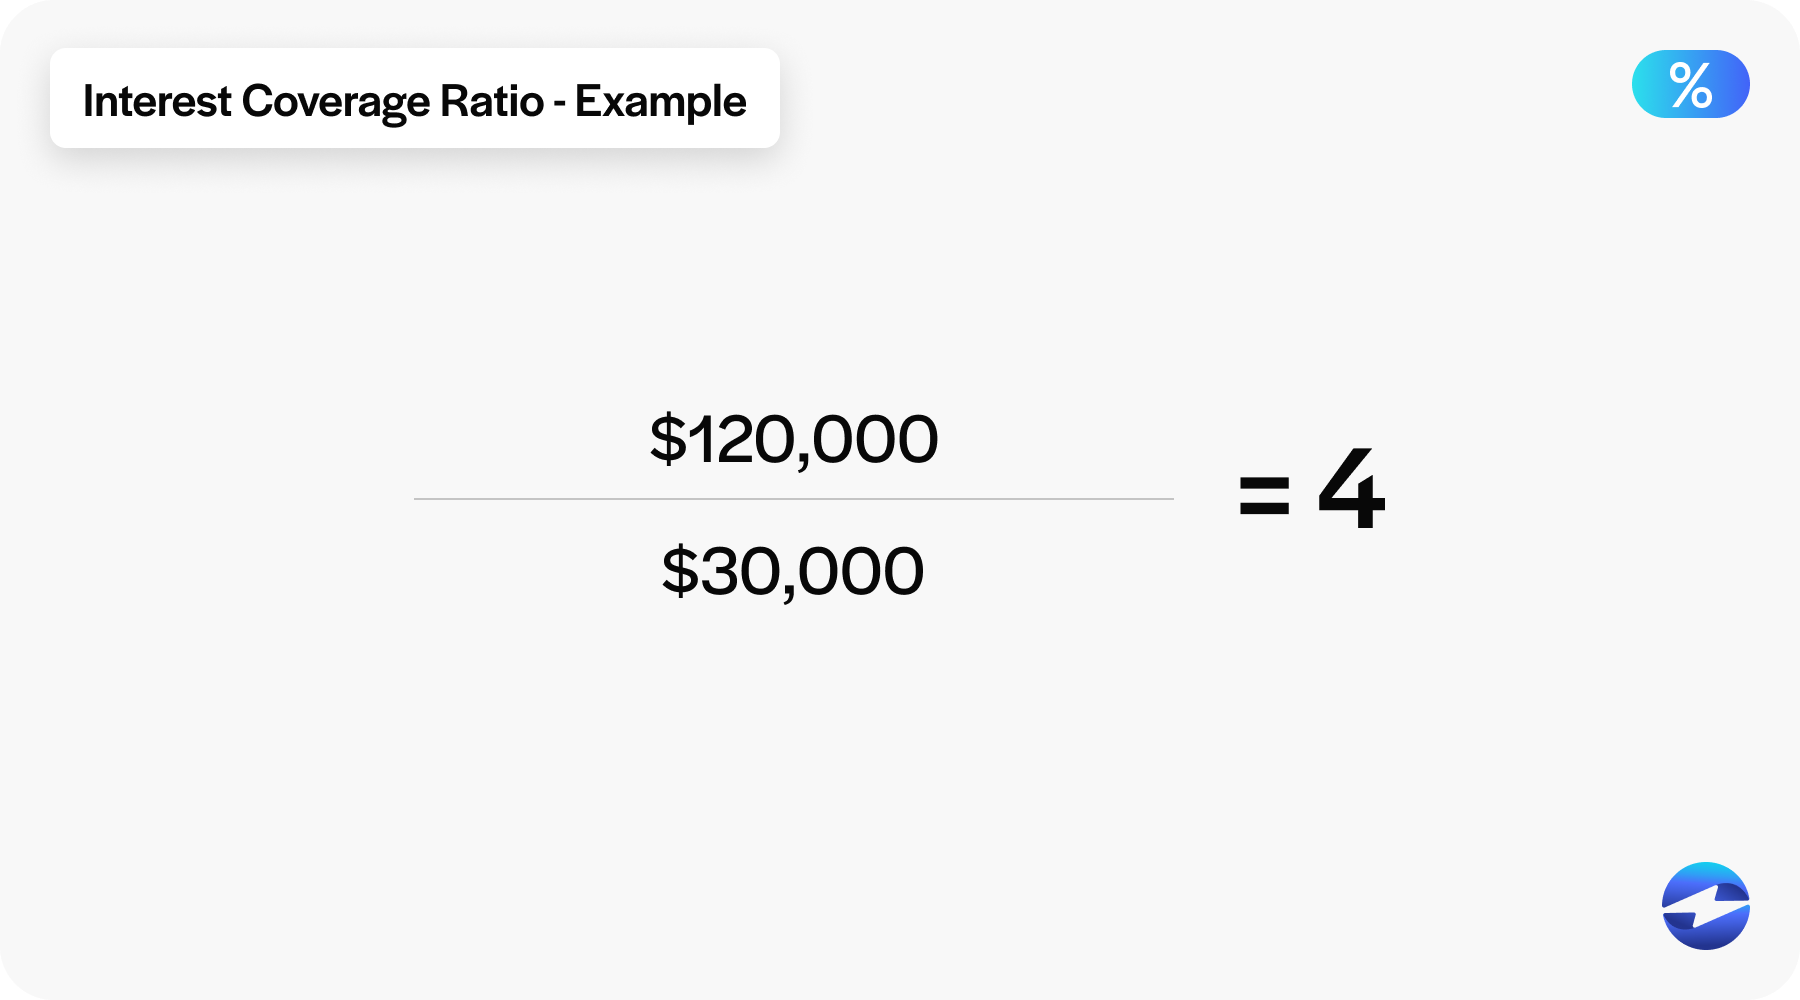
Interest Coverage Ratio = $120,000 / $30,000 = 4
This result indicates that the company’s earnings can cover its interest expenses four times over. A ratio of 1 would mean the company can barely meet its interest expenses, while a figure significantly greater than 1 suggests a comfortable buffer against financial distress related to interest payments.
Debt-to-asset ratio
A debt-to-asset ratio calculates the percentage of a company’s assets financed by debt, providing a snapshot of its financial health and risk level.
Simply put, the debt-to-asset ratio reflects how a company uses borrowed money to fund its operations and growth. Analyzing this ratio helps stakeholders understand how capably a company can cover its debt obligations with its assets.
To calculate the debt-to-asset ratio, a company will need to input the total liabilities and total assets from its balance sheet. The ratio is found through the following equation:
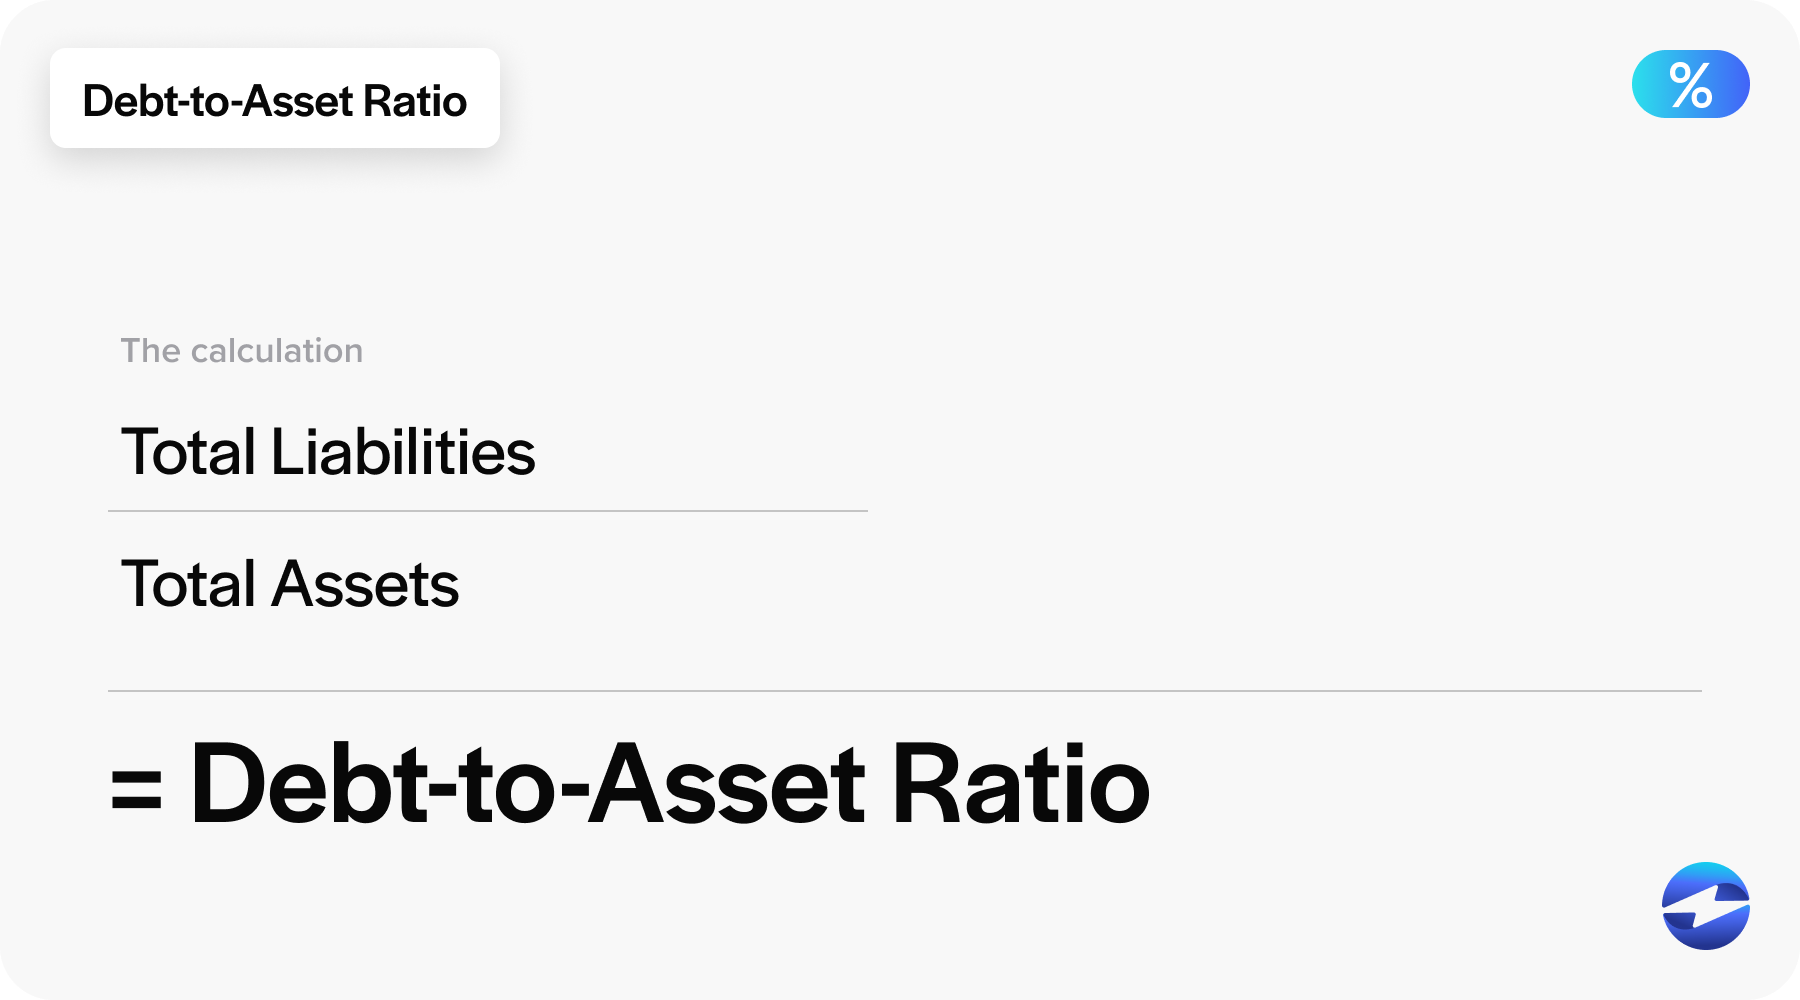
Debt-to-asset ratio = Total Liabilities / Total Assets
By dividing the total liabilities by the total assets, one can determine the proportion of a company’s assets financed by debt.
A lower percentage typically indicates a healthier capital structure with less dependence on debt. Conversely, a higher ratio may indicate greater financial risk due to heavy reliance on borrowed funds.
Debt-to-asset ratio example
To illustrate, assume that XYZ Manufacturing has total liabilities of $200,000 and total assets of $500,000. Using the debt-to-asset ratio formula:
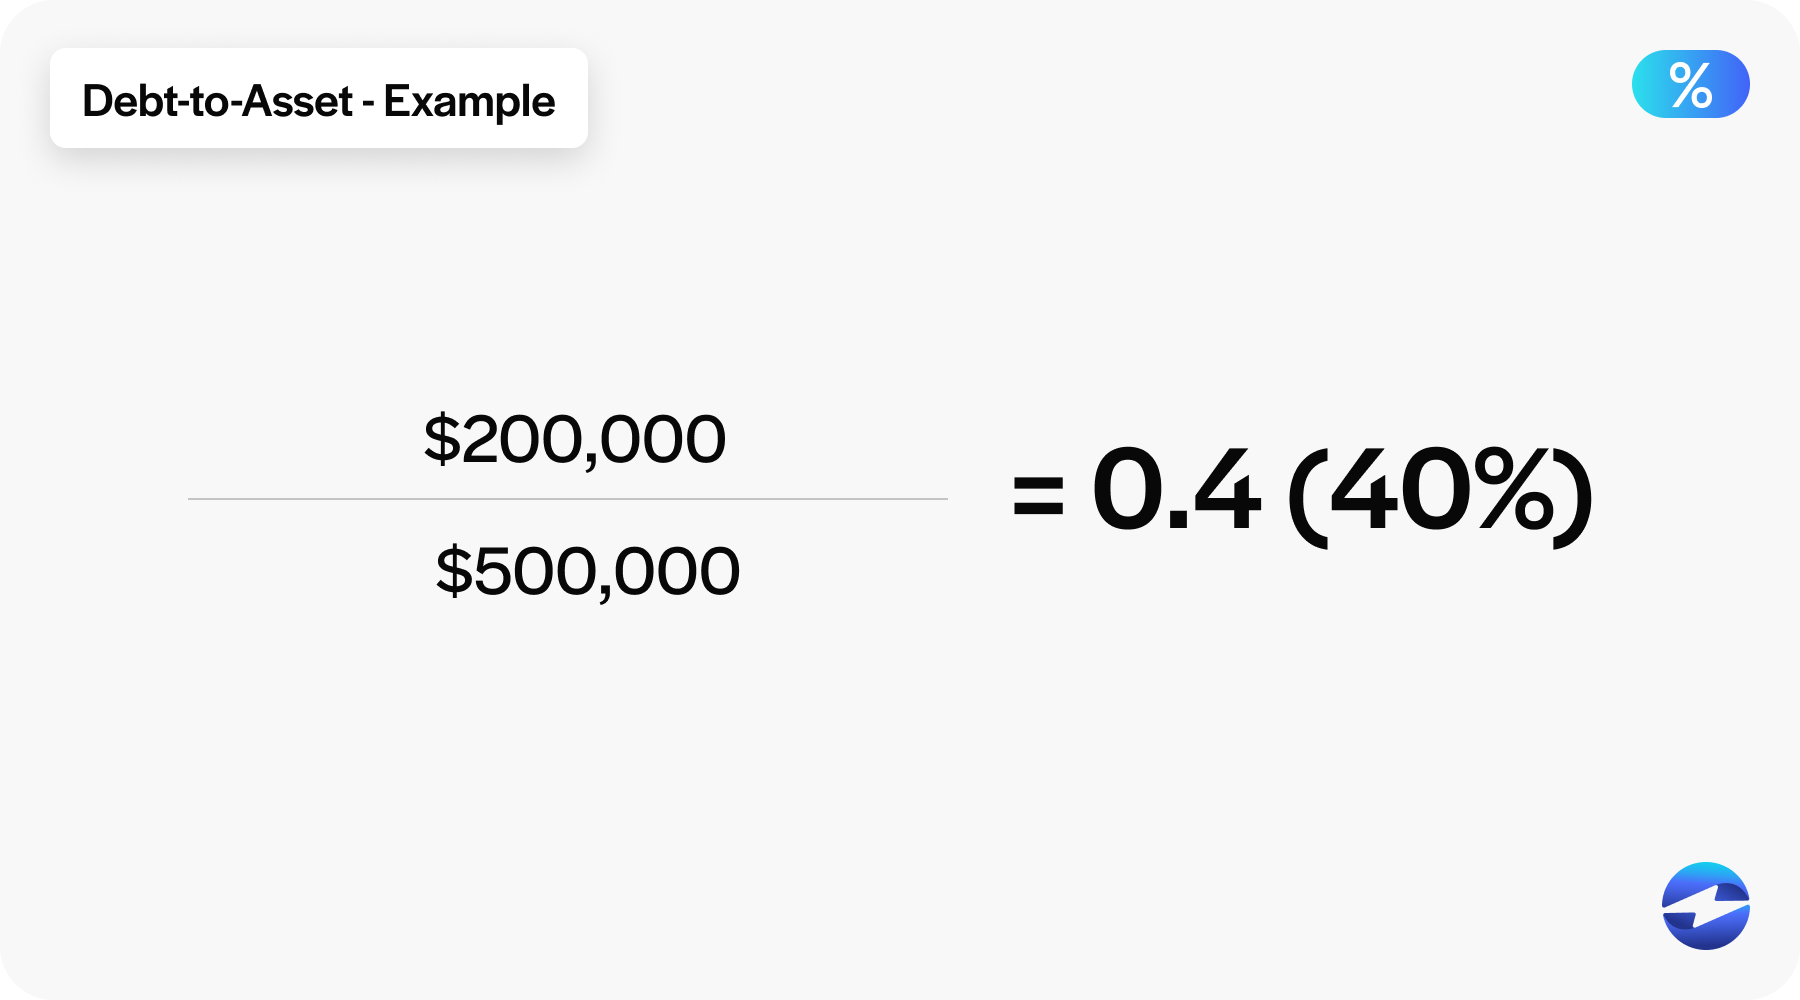
Debt-to-asset ratio = $200,000 / $500,000 Debt-to-asset ratio = 0.4 or 40%
This outcome suggests that 40% of XYZ Manufacturing’s assets are funded through debt. Creditors and investors can use this information to evaluate the company’s financial structure and determine its ability to fulfill its financial commitments.
Equity ratio
The equity ratio is used by analysts and investors to determine how much of a company’s assets are funded by the owner’s equities and, thus, to assess the company’s underlying financial strength.
Unlike liquidity ratios, which focus on short-term obligations, the equity ratio emphasizes long-term economic stability by considering the capital structure. A higher equity ratio indicates less financial leverage and a more significant buffer against potential financial downturns. A low equity ratio can signal higher debt levels and a potential increase in financial leverage, which prospective business lenders and investors may find riskier.
To calculate the equity ratio, you can divide your company’s total equity by its total assets:
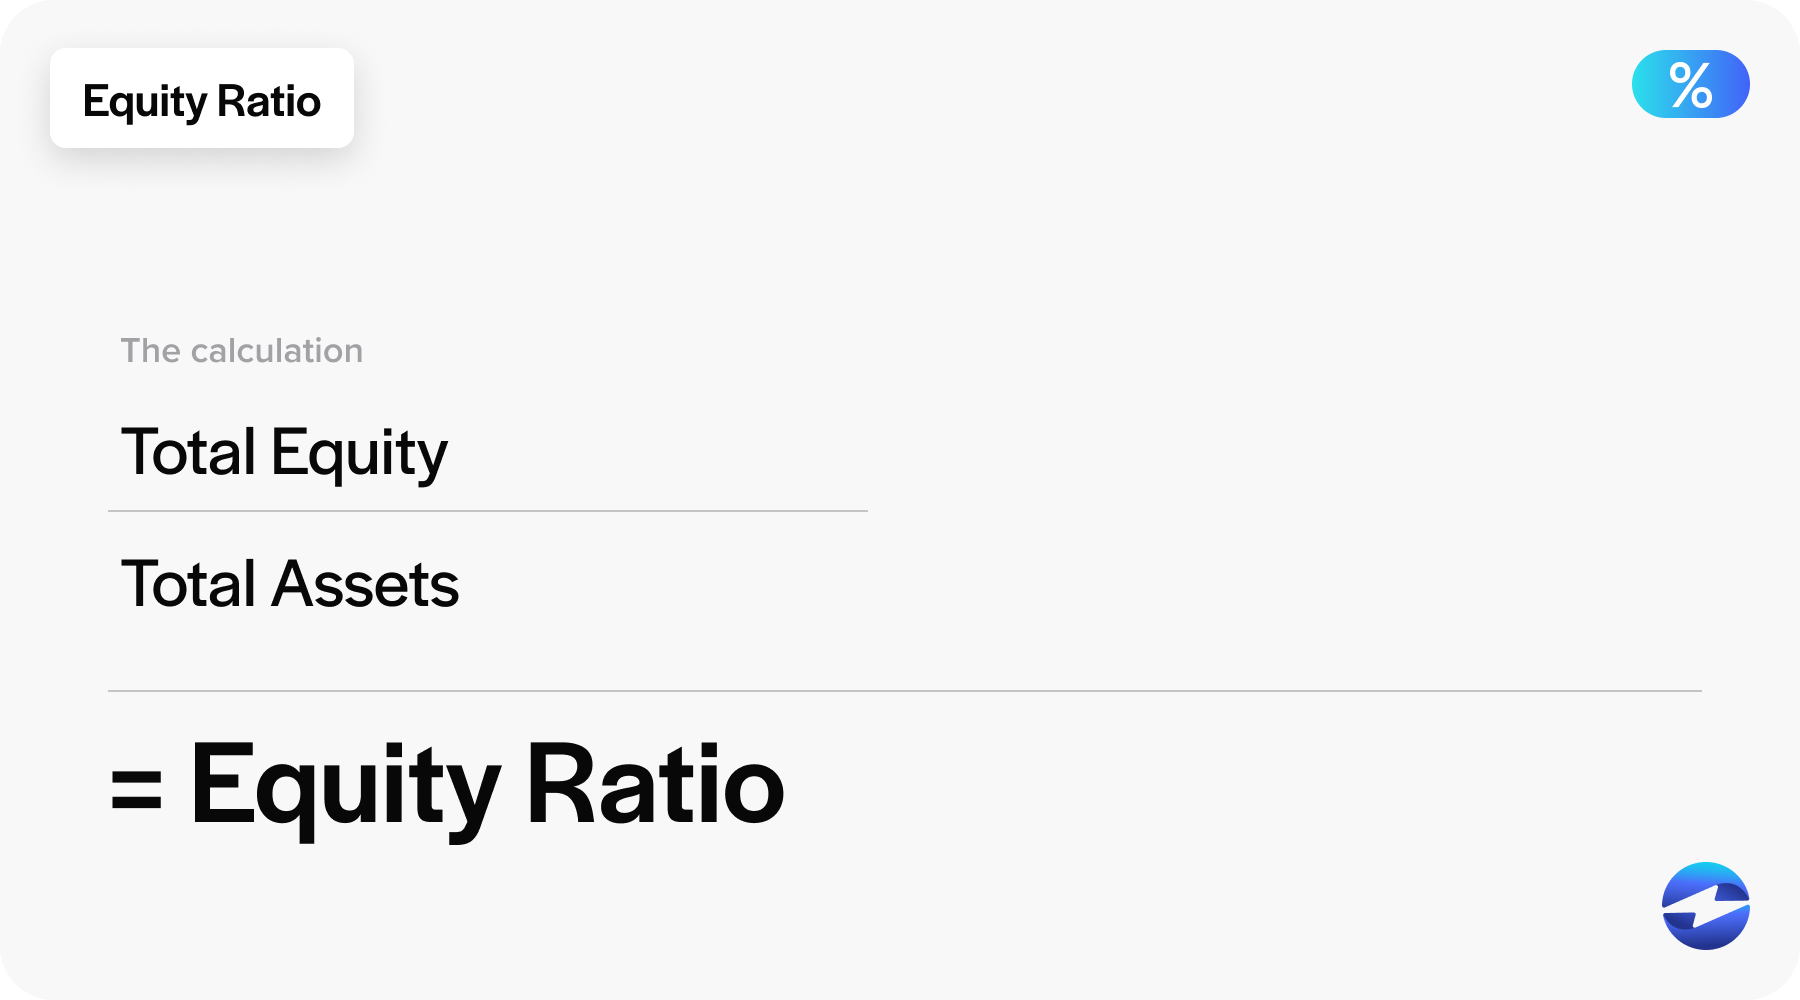
Equity Ratio = (Total Equity / Total Assets)
This equation can be readily found and applied using the information provided in financial statements such as balance sheets. The resulting figure, usually presented as a percentage, directly reflects the amount of assets owned outright by the shareholders.
Equity ratios vary across industries, so comparing within the same sector can provide a more accurate perspective on a company’s solvency.
Equity Growth Ratio Example
Say XYZ Manufacturing extracts financial statistics from their balance sheet that include a total equity of $800,000 and total assets totaling $2,000,000.
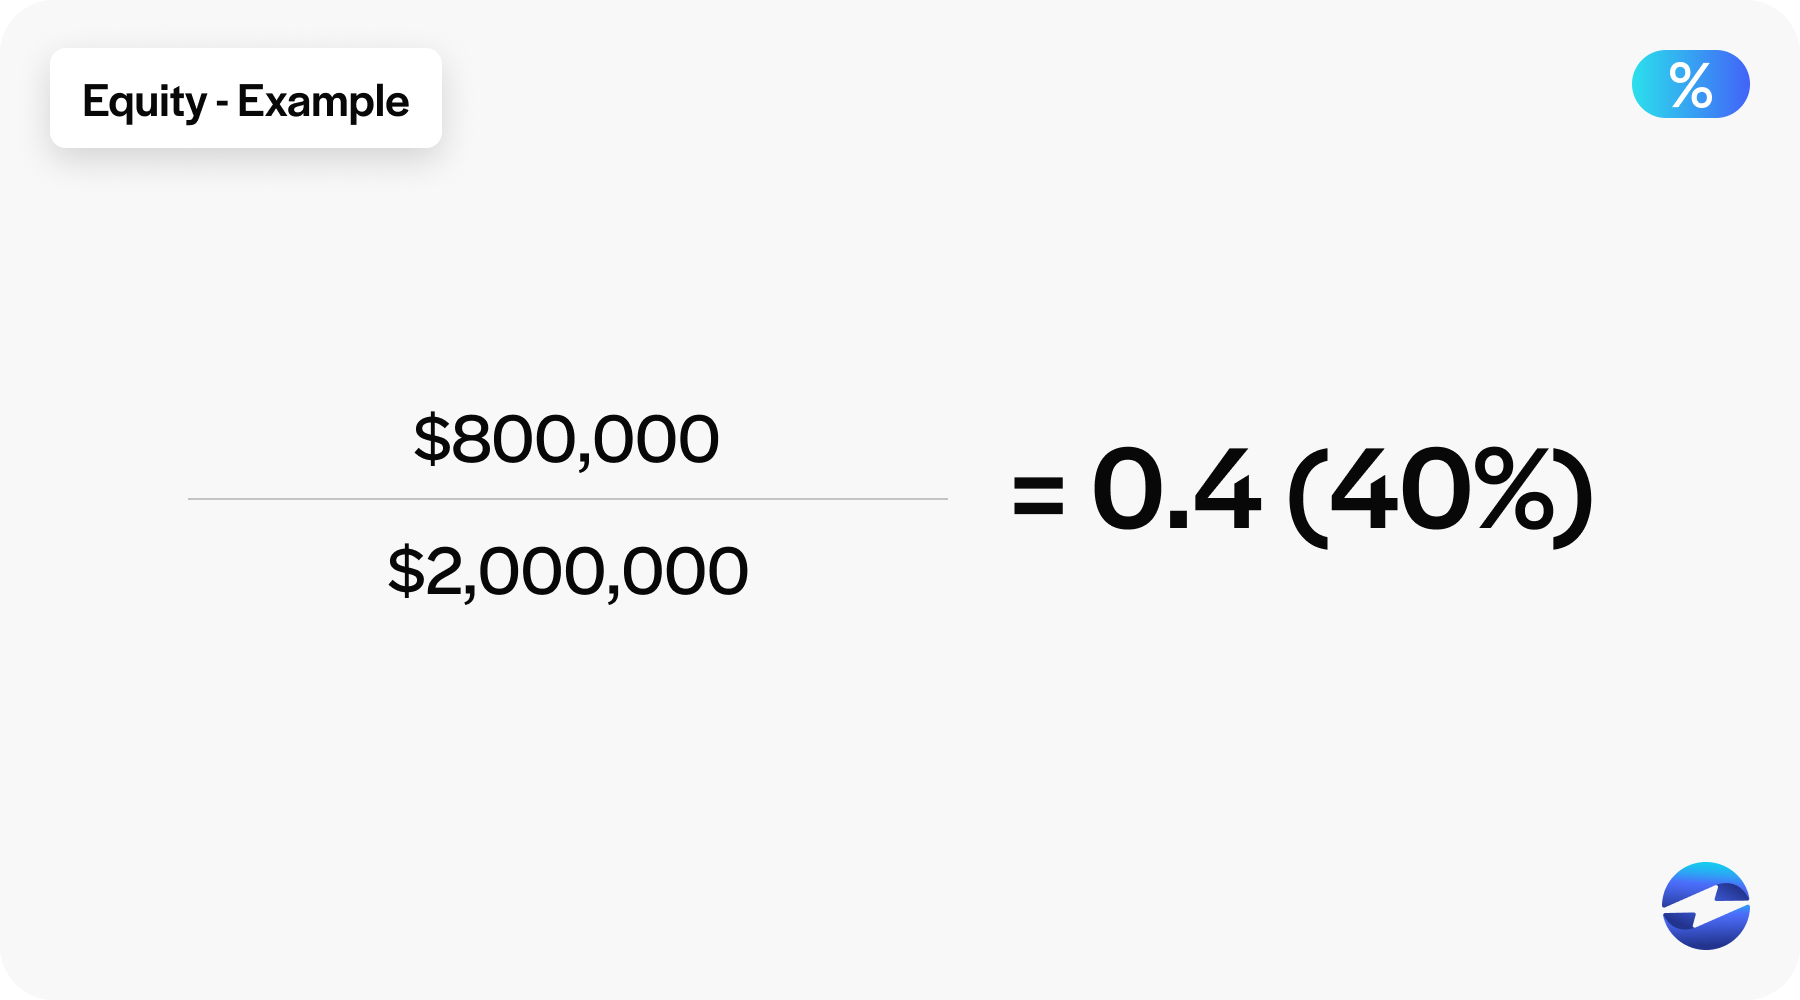
Equity Ratio = ($800,000 / $2,000,000) = 0.4 or 40%
This indicates that 40% of XYZ Manufacturing’s assets are financed through shareholder equity, representing a robust financial structure.
Debt-to-equity ratio
The debt-to-equity ratio compares total liabilities to shareholders’ equity to gauge a company’s economic health and measures the proportion of operations funded by debt versus wholly owned funds.
Commonly scrutinized by lenders, credit analysts, and investors, the debt-to-equity ratio indicates the company’s ability to meet long-term financial obligations.
An elevated debt-to-equity ratio can suggest higher financial risk as the company relies more on borrowing. Conversely, a lower ratio implies that the business is less reliant on external debt financing – potentially positioning it as a less risky investment.
To calculate the debt-to-equity ratio, you can reference your company’s balance sheet to plug its total liabilities and shareholders’ equity into a simple formula:
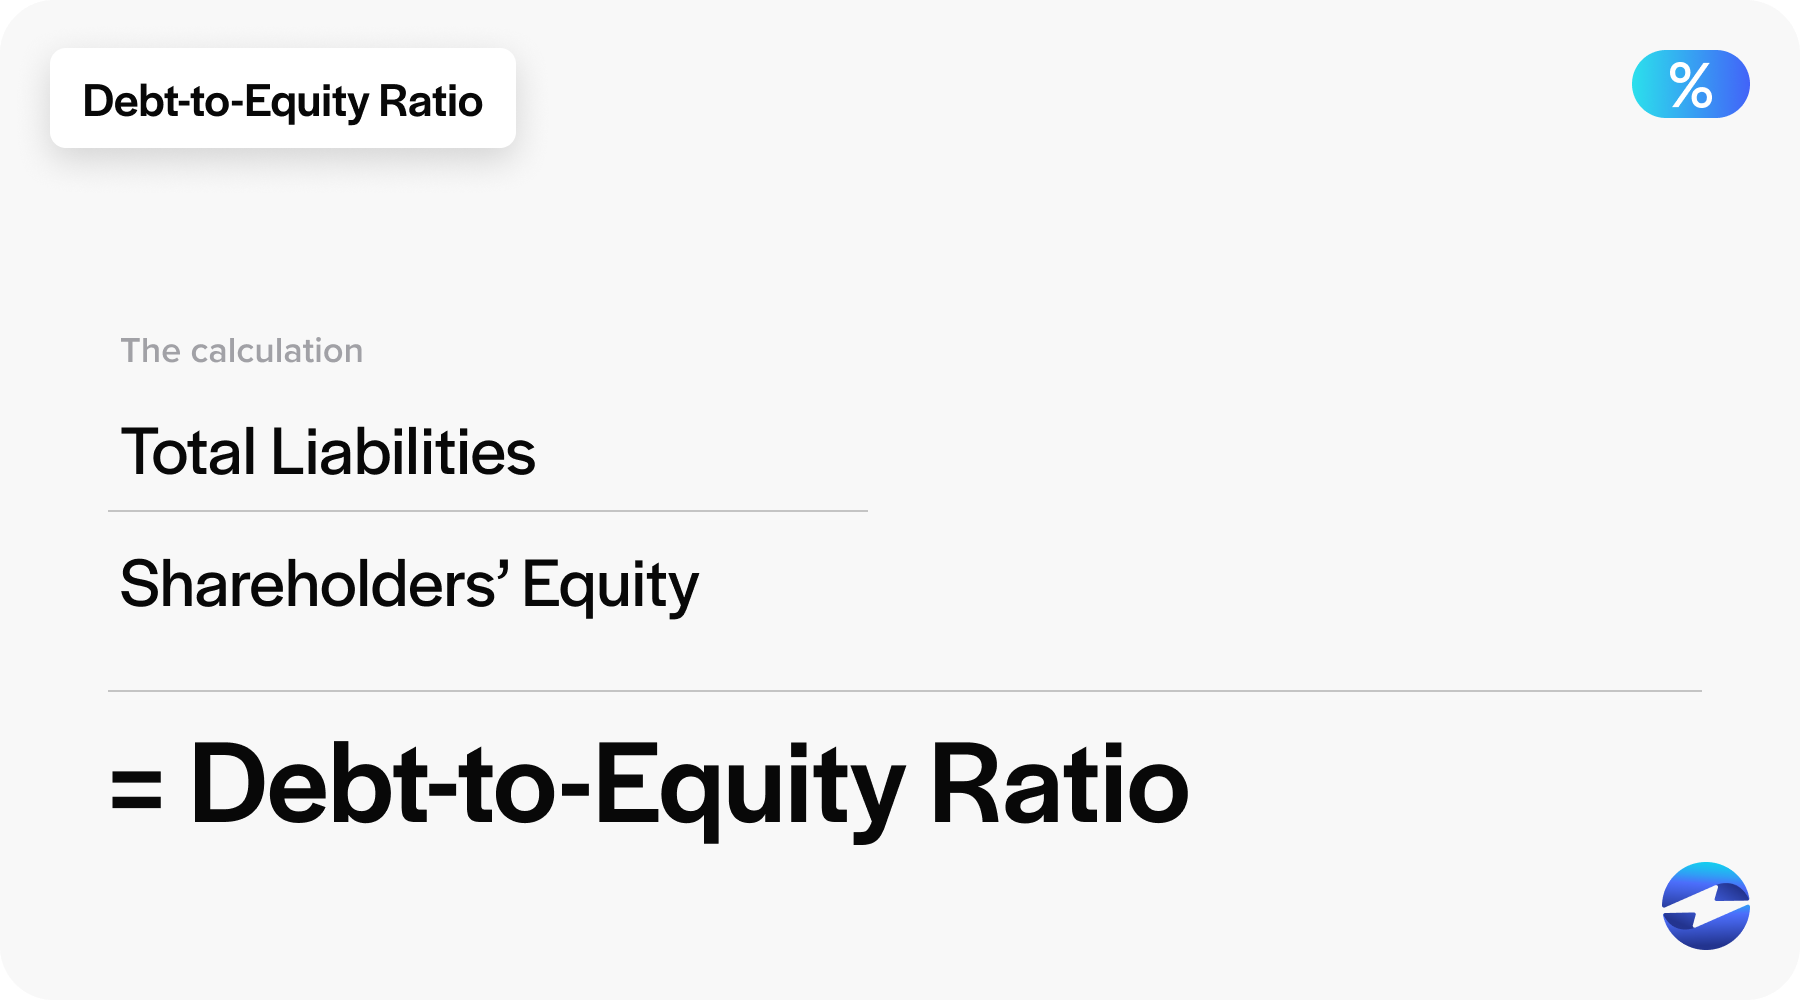
Debt-to-Equity Ratio = Total Liabilities / Shareholders’ Equity
Total liabilities encompass long-term debt, such as bonds and mortgages, and short-term liabilities, including various creditors and short-term debt. Shareholders’ equity is the residual interest in the assets of the entity after deducting liabilities and can be considered the net value of the company to shareholders.
Debt-to-equity example
For instance, ABC Manufacturing looks at its financial statements and finds its total liabilities come out to $250,000, and its shareholders’ equity totals $500,000.
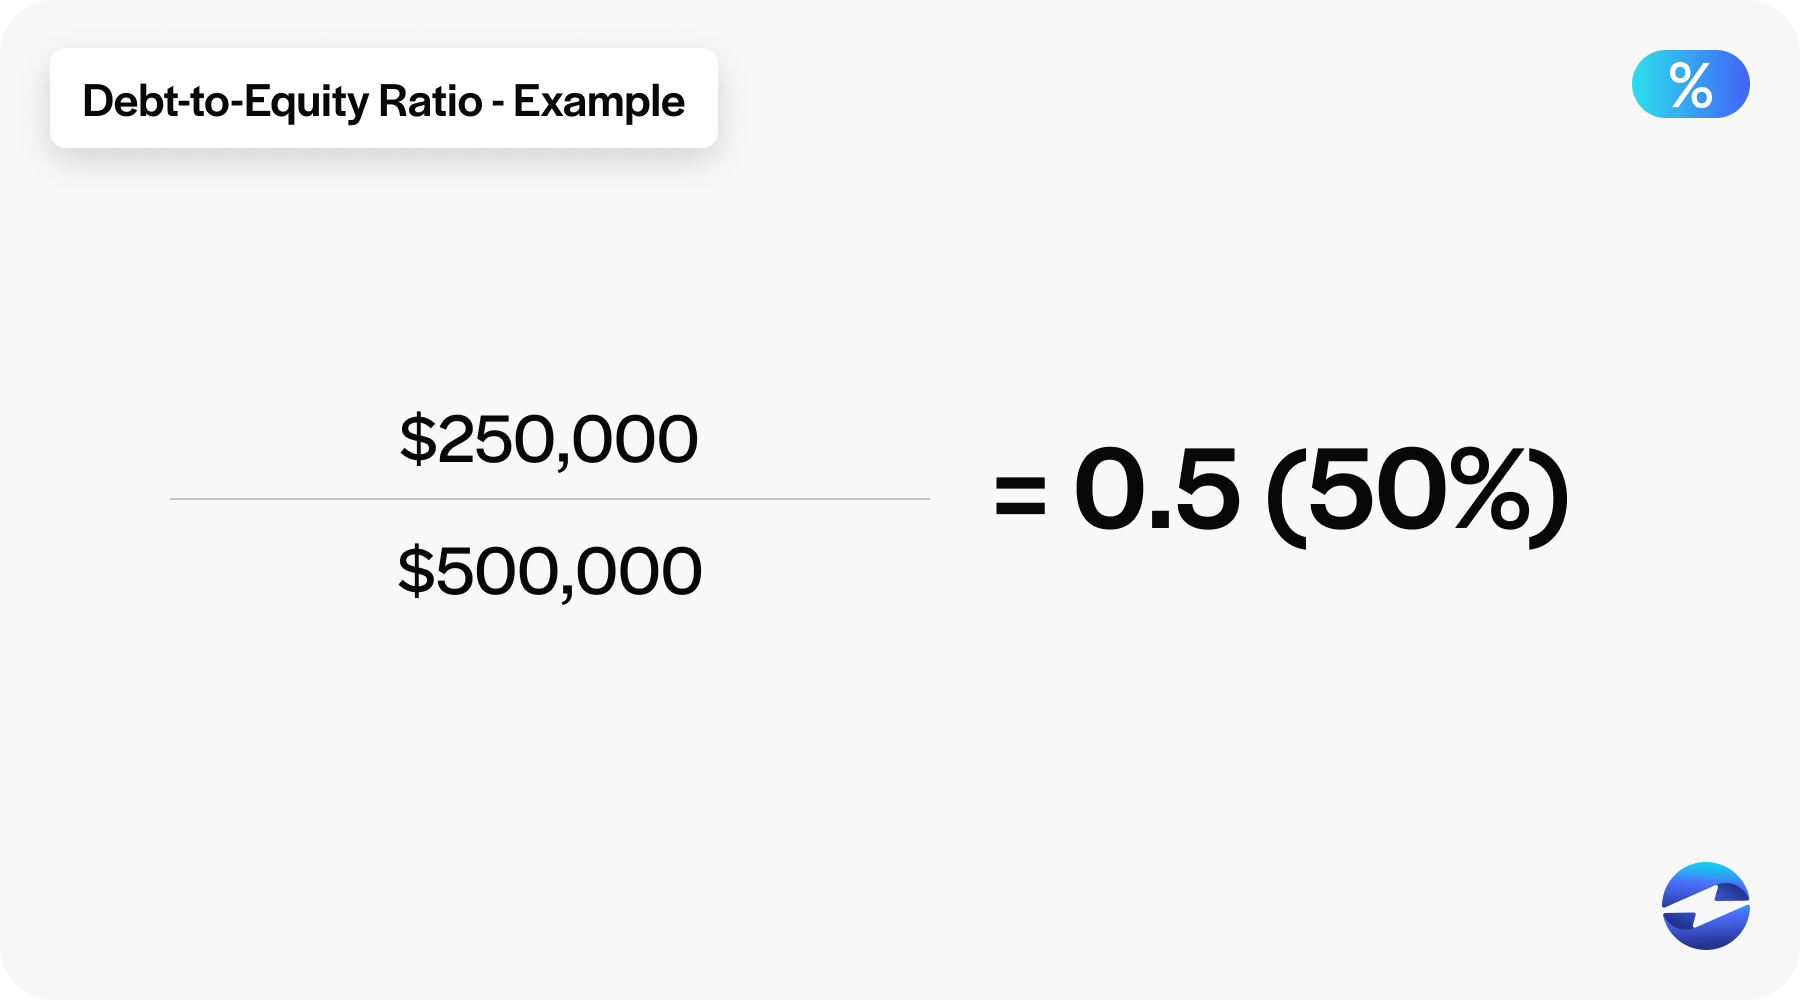
Equity Debt-to-Equity Ratio = $250,000 / $500,000 Debt-to-Equity Ratio = 0.5 or 50%
This ratio tells us that ABC Manufacturing has $0.50 in debt for every dollar of equity, which can be viewed as a moderate leveraging of the company’s assets. This moderate leverage in the capital structure may attract prospective business lenders looking for a balance between financial risk and the potential for higher returns through economic leverage.
Interpreting solvency ratios
When analyzing solvency ratios, it’s essential to comprehend the multifaceted aspects of financial risk and stability linked to a company. A comprehensive review examines various solvency ratios, such as the equity, asset, and leverage ratios.
Each ratio captures a unique angle when evaluating a company’s financial position.
What do high and low solvency ratios indicate?
Solvency ratios directly affect the assessment of a business’s financial viability, so it’s essential to know what these ratios indicate.
A high solvency ratio typically indicates more excellent assets relative to liabilities, signifying strength in economic stability and capacity to meet long-term debt and obligations. This scenario often reflects positively in the eyes of investors and creditors, as it suggests a sustainable and less risky financial position.
Conversely, a low solvency ratio indicates a higher proportion of liabilities than assets, indicating possible financial weakness and increased risk. This financial structure may signal trouble meeting debt obligations, deter potential investors, or lead to higher borrowing costs.
Now that you know what high and low solvency ratios indicate, the following section covers each industry’s solvency ratio level.
Solvency ratios in different industries
Solvency ratios vary significantly across different industries, reflecting the distinctive nature of financial stability required in each sector.
In industries such as utilities or telecommunications, capital-intensive operations necessitate a higher tolerance for debt. Thus, solvency ratios in these sectors may demonstrate greater levels of long-term debt without signaling financial distress.
Conversely, technology or retail sectors typically showcase lower solvency ratios, indicating less reliance on debt due to faster cash flow cycles and lower fixed asset investments.
Manufacturing industries often exhibit moderate solvency ratios since their operations hinge on a balance between debt for equipment and maintaining liquid assets for operational needs. Financial service providers, such as banks, employ unique leverage ratios and regulatory capital ratios to gauge solvency, acknowledging the substantial role of debt and equity in their capital structure.
Below is an illustrative industry comparison of common solvency ratios:
| Industry | Debt to Equity Ratio | Debit Ratio | Equity Ratio |
|---|---|---|---|
| Utilities | High | High | Moderate/Low |
| Telecommunications | High | High | Moderate/Low |
| Technology | Low/Moderate | Low | High |
| Retail | Low/Moderate | Low | High |
| Manufacturing | Moderate | Moderate | Moderate |
| Financial Services | Regulated | Regulated | Regulated |
Understanding the industry context is essential in evaluating the actual financial position represented by solvency ratios in financial statements and balance sheets.
Limitations of solvency ratios
Despite their usefulness, solvency ratios have limitations. While they offer a snapshot using information from financial statements, they may not account for recent changes in a company’s financial position or market conditions.
Additionally, solvency ratios may not capture the full complexity of a company’s capital structure, mainly if it uses sophisticated financial instruments that aren’t represented accurately on balance sheets.
Comparing solvency ratios across different industries can also be misleading due to the diversity of financing requirements and capital intensity in various sectors.
Additionally, these ratios depend heavily on the quality of the underlying accounting information. If financial statements are inaccurate or manipulated, solvency ratios won’t provide an accurate picture of economic health.
Lastly, solvency ratios ignore qualitative factors such as management competency, market position, or brand strength, which can significantly impact a company’s ability to continue operations and fulfill debt obligations.
While solvency ratios can indicate financial leverage and risk, they must be considered alongside other factors for a comprehensive assessment of financial stability.
Simplify cash flow with EBizCharge
While solvency ratios help businesses understand their level of cash flow, EBizCharge helps improve that cash flow. EBizCharge offers comprehensive accounts receivable automation that can improve a company’s cash flow and overall financial health, directly impacting its solvency ratios. By streamlining payment processes and reducing transaction costs, EBizCharge helps businesses manage their cash flow more effectively, ensuring they have the liquidity to meet long-term obligations.
EBizCharge’s robust reporting tools provide valuable financial insights, enabling companies to monitor their financial health and make data-driven decisions to maintain strong solvency ratios, all connected through payment integrations for ERP and accounting software that keep your financial data accurate across every platform your team relies on. By leveraging EBizCharge, businesses can secure a more stable financial future and enhance their capacity to meet long-term debt obligations.

